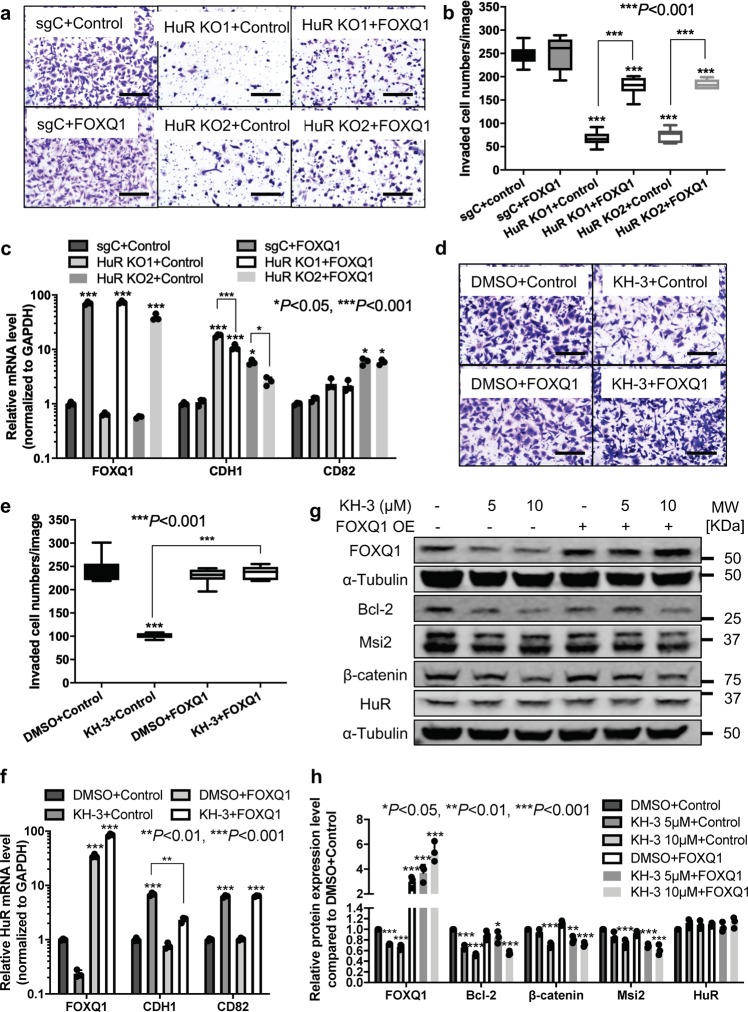
Fig. 7. FOXQ1 contributes to HuR role in promoting cell invasion.
a, b Invasion assay in parental MDA-MB-231 cells, sgControl and two HuR KO clones transfected with control vector or vector containing FOXQ1 cDNA. a Representative images of stained invaded cells, scale bars: 200 μm. b The number of invaded cells per image (***P < 0.001, one-way ANOVA, n = 6). c mRNA expression levels of FOXQ1, CDH1 and CD82 in parental MDA-MB-231 cells, sgControl and two HuR KO clones transfected with control vector or vector containing FOXQ1 cDNA. Values are mean ± SD from n = 3 independent experiments (*P < 0.05, ***P < 0.001, two-way ANOVA). d, e Invasion assay in MDA-MB-231 cells transfected with control vector or vector containing FOXQ1 cDNA together with DMSO or 10 μM KH-3 treatment. d Representative images of stained invaded cells, scale bars: 200 μm. e The number of invaded cells per image (***P < 0.001, one-way ANOVA, n = 6). f mRNA expression levels of FOXQ1, CDH1 and CD82 in MDA-MB-231 cells transfected with control vector or vector containing FOXQ1 cDNA together with treatment of DMSO or 10 μM KH-3. Values are mean ± SD from n = 3 independent experiments (**P < 0.01, ***P < 0.001, two-way ANOVA). g, h Protein expression levels of FOXQ1, Bcl-2, Msi2, β-catenin, and HuR in MDA-MB-231 cells transfected with control vector or vector containing FOXQ1 cDNA together with treatment of DMSO or KH-3 at the indicated doses for 48 h. α-Tubulin is used as loading control. g Representative western blot results from one experiment. h Quantified relative expression of HuR and downstream targets. Values are mean ± SD from n = 3 independent experiments (*P < 0.05, **P < 0.01, ***P < 0.001, two-way ANOVA).

