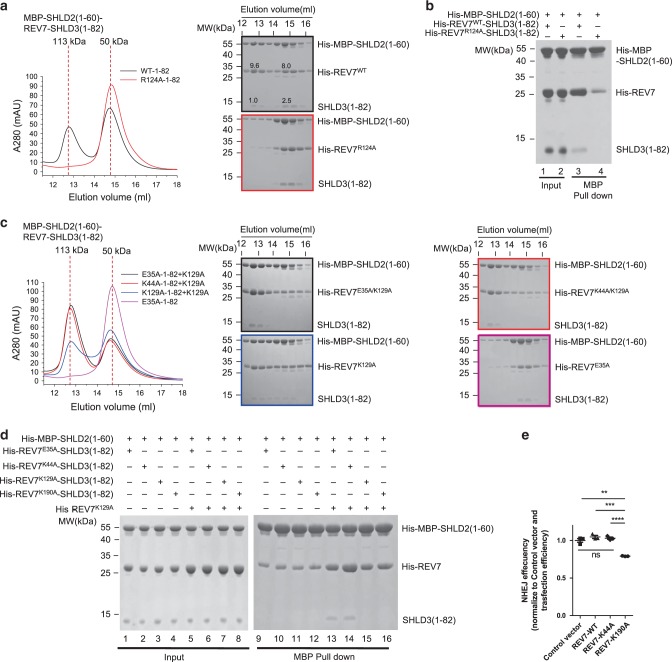
Fig. 5. SHLD3 mediated REV7 conformational dimer is essential for the recruitment of SHLD2.
a Gel filtration profiles show the interaction between REV7WT/R124A-SHLD3(1–82) (short as WT/R124A-1–82 in the Figure) and MBP-SHLD2(1–60) in a Superdex200 Increase 10/300 size exclusion chromatography (SEC) column (the left panel). MBP-SHLD2(1–60) is excessive. The peaks eluted at 12.5–13 ml are composed of the stable complex of MBP-SHLD2(1–60)-REV7-SHLD3(1–82) while the peaks eluted at 14.5–15 ml are un-complexed MBP-SHLD2(1–60) or REV7-SHLD3(1–82). Fractions (0.5 ml each) corresponding to REV7WT-SHLD3(1–82) and MBP-SHLD2(1–60) co-elution (black), REV7R124A-SHLD3(1–82) and MBP-SHLD2(1–60) co-elution (red) were analyzed by SDS-PAGE and stained by Coomassie brilliant blue (the right panel). (n = 2). b MBP pulldown showing the interaction between MBP-SHLD2(1–60) and REV7WT/R124A-SHLD3(1–82). Samples were analyzed by SDS-PAGE and stained by Coomassie brilliant blue. (n = 4). c Gel filtration profiles show the interaction between REV7 mutants and MBP-SHLD2(1–60). Various mutants of REV7-SHLD3(1–82) complex (200 μg) were first incubated with or without REV7K129A (short as K129A in the Figure) (200 μg), after 10 min, excessive MBP-SHLD2(1–60) was added. Fractions (0.5 ml each) corresponding to REV7E35A-SHLD3(1–82)-REV7K129A (short as E35A-1–82 + K129A in the Figure) and MBP-SHLD2(1–60) co-elution (black), REV7K44A-SHLD3(1–82)-REV7K129A (short as K44A-1–82 + K129A in the Figure) and MBP-SHLD2(1–60) co-elution (red), REV7K129A-SHLD3(1–82)-REV7K129A (short as K129A-1–82 + K129A in the Figure) and MBP-SHLD2(1–60) co-elution (blue), REV7E35A-SHLD3(1–82) (short as E35A-1–82 in the Figure) and MBP-SHLD2(1–60) co-elution (pink) were analyzed by SDS-PAGE and stained by Coomassie brilliant blue (the right panel). (n = 2). d MBP pulldown assay shows the interaction between MBP-SHLD2(1–60) and REV7-SHLD3(1–82) mutants or reconstituted conformational dimer. Samples were analyzed by SDS-PAGE and stained by Coomassie brilliant blue. (n = 2). e NHEJ efficiency was determined in Hela cells overexpressing exogenous FLAG-tagged wild-type REV7, REV7-K44A, REV7-K190A or control vector. Data were analyzed with the unpaired two-tailed Student’s test. Error bars indicate SEM (n = 3). Ns, no significant difference, **p < 0.01, ***p < 0.001, ****p < 0.0001. Exact p-values are 0.0011 (Control versus REV7-K190A), 0.00024 (REV7-WT versus REV7-K190A), 0.000093 (REV7-K44A versus REV7-K190A), 0.22 (Control versus REV7-WT), 0.36 (Control versus REV7-K44A) and 0.54 (REV7-WT versus REV7-K44A). n, biologically independent experiments. Source data are provided as a Source Data file.

