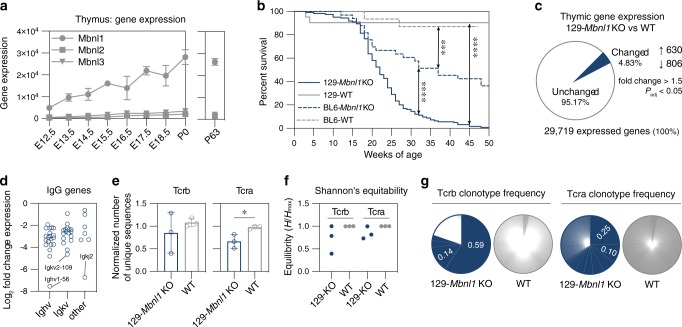
Fig. 1. Mbnl1 regulates thymic development.
a Mbnl1, Mbnl2 and Mbnl3 gene expression levels during thymus organogenesis and in the developed gland. RNA-seq was performed at embryonic (E) days: 12.5 (n = 3), 13.5 (n = 3), 14.5 (n = 2), 15.5 (n = 2), 16.5 (n = 3), 17.5 (n = 2), 18.5 (n = 2) and postnatal days 0 (P0; n = 2) and 63 (P63; n = 3). Points connected by lines show mean expression ± standard deviation (SD). Data from embryonic and P0 thymi were obtained from GSE107910. b Survival curves for 129-Mbnl1 knockout (KO) (n = 124, female/male ratio is 49/75), B6-Mbnl1 KO (n = 33, 16/17), 129-wild type (WT) (n = 21, 7/14) and B6-WT (n = 21, 10/11). Significant differences between survival distributions were determined by Mantel–Cox (log-rank) test: *** P < 0.001; **** P < 0.0001. Median survivals are 22 and 37 weeks of age for 129-Mbnl1 KO and B6-Mbnl1 KO, respectively. There are no significant differences between females and males. c Gene expression changes in 129-Mbnl1 KO thymus. Pie chart represents the proportion of significantly altered genes (blue) to all detected genes (gray) in 129-Mbnl1 KO (n = 3) compared to WT (n = 3) RNA-seq samples. d Scatter plot represents 44 downregulated genes encoding immunoglobulin heavy (Ighv; 20 genes), kappa (Igkv; 17 genes) and other (7 genes) chains. Each dot represents a significantly changed gene by DESeq2 analysis. The most affected gene for each group is indicated. e Reduction of the TCR repertoire detected by Mbnl1 KO RNA-seq. Bar graph shows number of unique Tcrb and Tcra sequences normalized to the unique mapped read count ± SD. Significant difference was determined by two-tailed t-test: * P = 0.027. f Tcrb (n = 3) and Tcra (n = 3) repertoire diversity reflected by Shannon’s equitability where 1 equals complete equivalency. g Pie charts demonstrate representative Tcrb and Tcra clonotype frequencies in 129-Mbnl1 KO and WT thymic RNA-seq. Gray areas represent unique clones from the total clone count. Source data are provided as a Supplementary Data 1 file.

