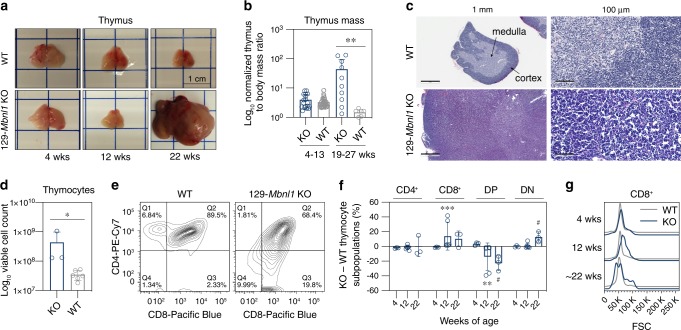
Fig. 2. Thymic hyperplasia in aged Mbnl1 KO mice.
a Representative photos of male WT and 129-Mbnl1 KO thymi at 4, 12, and 22 weeks of age. The normal process of thymic involution that occurs in WT is disrupted in 129-Mbnl1 KO at 22 weeks. b Male thymic wet weight normalized to body weight is significantly increased in 129-Mbnl1 KO (n = 10) compared to WT (n = 6) at 19–27 weeks. There is no significant difference between 4 and 13 weeks (WT = 50, KO = 18). Bar graph shows mean ± SD. Significant difference was determined by the Mann-Whitney test: **P = 0.003. c Hematoxylin and eosin (H&E) stain of WT and enlarged 129-Mbnl1 KO thymi. d Increased number of viable thymocytes in enlarged 129-Mbnl KO (n = 3) compared to WT (n = 6) thymi by ~22 (20± 2) weeks. Bar graph shows mean ± SD. Significant difference was determined by the Mann–Whitney test: *P = 0.024. e Representative flow cytometry analysis of CD4 and CD8 expression in ~22 weeks WT and 129-Mbnl1 KO thymocytes. f Thymocyte composition at 4 (WT = 3; KO = 3), 8 (WT = 8; KO = 6), and ~22 (WT = 4; KO = 3) weeks. CD4+, CD8+, CD4+CD8+ double positive (DP) and CD4-CD8- double negative (DN) thymocytes were analyzed by flow cytometry. Graph represents mean KO–WT subpopulations ± SD. Significant difference was determined by the Mann–Whitney test: # P = 0.057, **P = 0.007, ***P = 0 .0007. g Representative flow cytometry Forward Scatter (FSC) parameter plots showing different relative thymocyte CD8+ cell sizes in 129-Mbnl1 KO. Source data are provided as a Supplementary Data 1 file.

