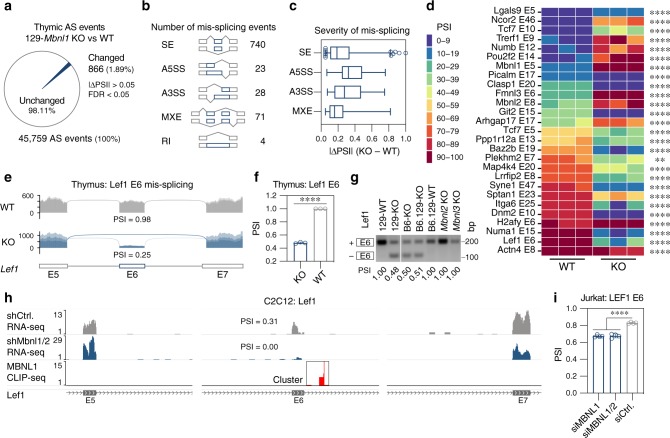
Fig. 3. Alternative splicing changes in Mbnl1 KO thymus.
a Alternative splicing (AS) changes in 129-Mbnl1 KO thymus. Pie chart represents the proportion of significantly altered AS events (blue) to all detected AS events (gray) in the 129-Mbnl1 KO (n = 3) compared to WT (n = 3). b Number of significantly changed AS events categorized as skipped exons (SE), alternative 5′ and 3′ splice sites (A5SS and A3SS), mutually exclusive exons (MXE) and retained introns (RI). c Wide range of splicing changes. Box plot of AS event | ΔPSI | values. PSI—percent spliced in. Center line represents the median, and the box extends from the 25th to 75th percentiles. Whiskers show 1–99 percentile. d Heat map illustrates selected 27 AS events changed in Mbnl1 KO thymus (compare to Fig. 5e). ** FDR < 0.01, **** FDR < 0.0001. e Sashimi plot of Mbnl1 KO (n = 3) and WT (n = 3) RNA-seq samples for Lef1 E5-E6-E7. Mean PSI values are provided below the plots. f Lef1 E6 exclusion in 129-Mbnl1 KO (n = 3) compared to WT (n = 3) thymi detected by RT-PCR. Bar graph shows mean PSI ± SD. Significant difference was determined by the two-tailed t-test: **** P < 0.0001. g Representative gel of Lef1 E6 RT-PCR assay from the different Mbnl1 KO strains as well as Mbnl2 and Mbnl3 KOs. PSI values are provided below each gel lane. h Genome browser view of RNA-seq generated from C2C12 cells with the compound Mbnl1 and Mbnl2 knockdown by shRNA. The cluster of MBNL1 CLIP-seq reads indicates MBNL1 binding sites in C2C12. i MBNL1 (n = 4) as well as compound MBNL1 and MBNL2 (n = 4) knockdown causes LEF1 E6 exclusion in human T cells (Jurkat). Bar graph shows mean PSI ± SD. Significant difference was determined by Dunnett’s multiple comparison test: **** adjusted P value (Padj) < 0.0001. Source data are provided as the Supplementary Data 1 and Source Data files.

