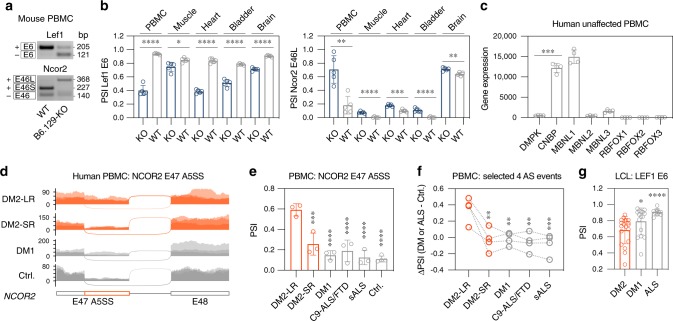
Fig. 4. Alternative splicing changes in Mbnl1 KO and DM2 PBMCs.
a Representative RT-PCR assay gel of Lef1 E6 and Ncor2 E46 A5SS from 129.B6-Mbnl1 KO and WT PBMCs. b 129.B6-Mbnl1 KO (n = 5) causes Lef1 E6 exclusion and Ncor2 E46L inclusion in peripheral blood mononuclear cells (PBMCs), muscle (tibialis anterior), heart, bladder and brain. Bar graphs show mean PSI ± SD. Significant difference was determined by the two-tailed t-test test: *P < 0.05, **P < 0.01, ***P < 0.001, ****P < 0.0001. c Gene expression in unaffected human PBMCs. Bar graph shows mean expression value ± SD. Significant difference was determined by two-tailed t-test test: ***P = 0.0003. d Sashimi plot of DM2-LR (>1000 CCTGs; n = 3), DM2-SR (~100 CCTGs; n = 3), DM1 (n = 3) and unaffected control (n = 4; PBMC extraction delayed by 24–48 h) RNA-seq samples for NCOR2 E47-E48. e Aberrant NCOR2 E47L inclusion in DM2-LR but not in DM2-SR, DM1, C9-ALS/FTD nor sALS. Bar graph shows mean PSI ± SD. Significant difference was determined by Dunnett’s multiple comparison test: ***Padj = 0.0004, ****P < 0.0001. f Before-after plot shows individual ΔPSI values for NCOR2 E47, MBNL1 E5, SYNE1 E61 and GIT2 E16 AS events. Note that ΔPSI values for GIT2 E16 are inverted. Significant difference was determined by Dunnett’s multiple comparisons test: **Padj < 0.01, **Padj = 0.0009. g Aberrant LEF1 E6 exclusion in a large cohort of DM2-derived LCLs (n = 19); DM1 (n = 16); ALS (n = 10). Significant difference was determined by Dunn’s multiple comparison test: *Padj = 0.019, ****Padj < 0.0001. Source data are provided as the Supplementary Data 1 and Source Data files.

