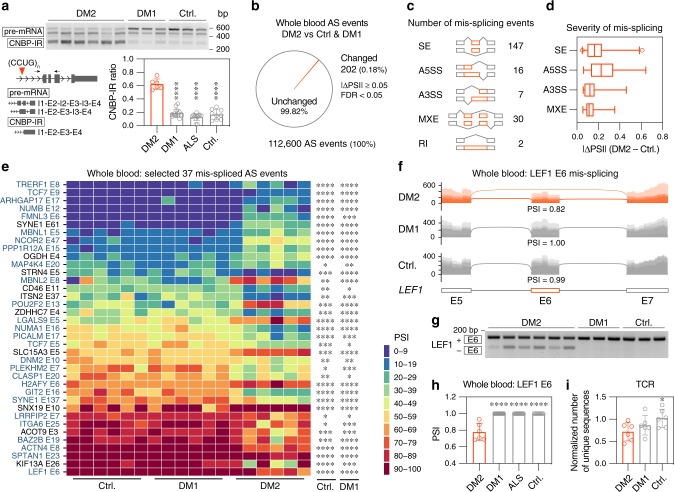
Fig. 5. Alternative splicing changes in DM2 whole blood.
a RT-PCR analysis of CNBP-IR in DM2 (n = 6), DM1 (n = 19), ALS = (n = 13) and unaffected control (n = 11) whole blood samples. Bar graph shows mean CNBP intron 1 retention ratio ± SD. Significant difference was determined by Dunnett’s multiple comparisons test: **** Padj < 0.0001. b Pie chart represents all detected AS events in whole blood RNA-seq. Orange triangle represents significantly changed AS events in DM2 (n = 6) compared to DM1 (n = 6) and unaffected (n = 6) controls. c Number of significantly changed AS events assigned to different categories. d Box plot of AS event | ΔPSI | values. Center line represents the median, and the box extends from the 25th to 75th percentiles. Whiskers show 1-99 percentile. e Heat map shows selected 37 AS events changed in DM2 compared to both DM1 and unaffected controls. Note that TCF7 E9 is the mouse Tcf7 E10 ortholog. * FDR < 0.05, ** FDR < 0.01, *** FDR < 0.001, **** FDR < 0.0001. f Sashimi plot with mean PSI values for LEF1 E6 in DM2 (n = 6), DM1 (n = 6) and unaffected control (n = 6) RNA-seq samples. g Representative RT-PCR assay gel of LEF1 E6 from DM2, DM1 and unaffected control (Ctrl.) whole blood samples. h Aberrant LEF1 E6 exclusion in a large cohort of DM2 (n = 6), DM1 (n = 19), ALS (n = 13) and unaffected (n = 11) control whole blood samples. Significant difference was determined by Dunnett’s multiple comparisons test: **** Padj < 0.0001 i Reduction of TCR repertoire detected in DM2 whole blood RNA-seq. Bar graph shows the total number of TRB and TRA clones normalized to uniquely mapped reads ± SD. Significant difference was determined by Dunnett’s multiple comparison test: * Padj = 0.042. Source data are provided as the Supplementary Data 1 and Source Data files.

