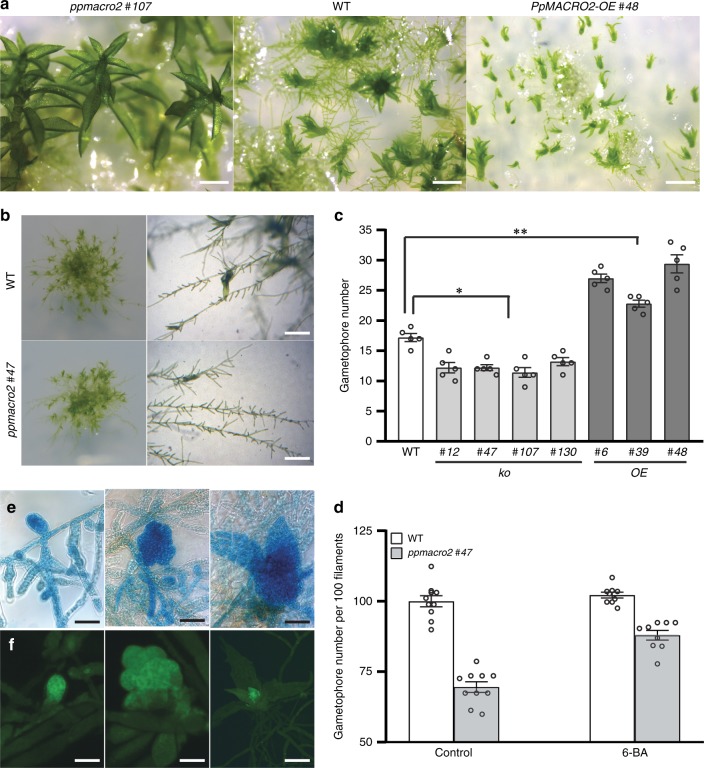
Fig. 3. PpMACRO2 affects the number of gametophores developed in P. patens.
a, c Number of gametophores developed from four-week-old WT, ko and OE plants. Seven-day-old protonemata of WT, ko and OE plants were harvested and suspended with sterile water, respectively, and then crushed. The same amount of suspension (OD600 = 0.4) was propagated onto BCD medium and grown for about four weeks. Gametophore numbers were counted under microscope’s field of view. Micrograph images given were observed from five biological replicates. Data show means ± s.e.m. of five biological replicates for WT and mutant plants. Asterisks indicate a statistically significant difference compared with WT plants based on a two-tailed Student’s t-test (*p < 0.05, **p < 0.01). b, d Number of gametophores per filament in WT and ko plants of PpMACRO2. Protonemata of approximately 1 mm in diameter were transplanted onto BCD medium from the wild type and ppmacro2 #47 respectively, and cultivated for three weeks. Ten clones were counted for the wild type and ko mutant, respectively. Under normal growth conditions, the ko mutant generated about 30% fewer gametophores than the wild type. However, under 1 µmol l−1 6-BA treatment, the number of gametophores in the ko mutant was only about 12% fewer compared to the wild type. Micrograph images provided were observed from ten biological replicates. Data show means ± s.e.m. of ten biological replicates. e, f GUS staining and green fluorescence of gametophore development. Left to right show a swollen gametophore apical cell, a gametophore with multiple cells, and a leafy gametophore, respectively. Micrograph images shown were observed from at least three biological replicates. Scale bars: 500 μm in a, b; 50 μm in e, f.

