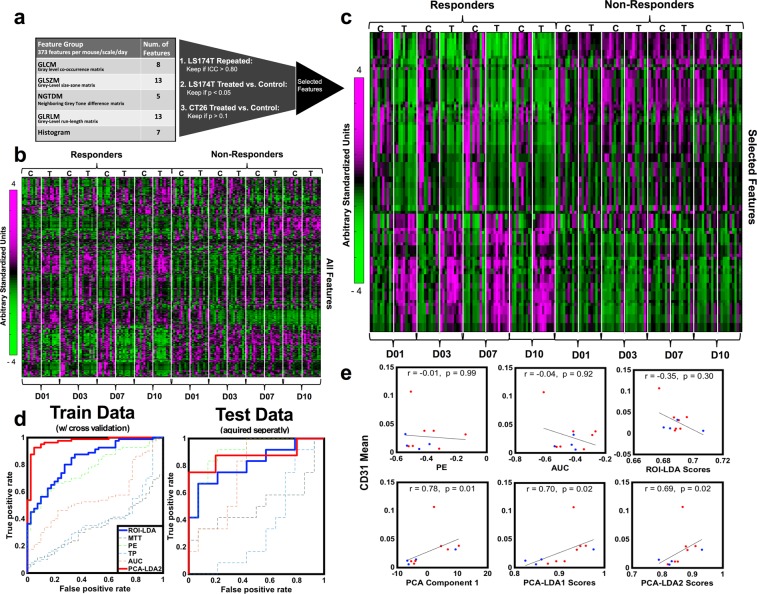
Figure 2.
(a) Statistics-based feature selection process based on repeatability and sensitivity to treatment. (b) Heatmap showing all features (y-axis) on days 1, 3, 7 and 10 (D01-D10) – features are measured as percent change from baseline. Left is responder (LS174T) group and right is non-responder (CT26) group, with both treated (T) and control (C). (c) Same as D), but after feature selection. Note that within the responder group, there is an oscillation between treated (T) and control (C) animals from day 1 onwards, not observed in non-responder group. (d) ROC for conventional parameters alone (PE, AUC, TP, MTT – thin lines), combined in an LDA model (ROI-LDA; blue) and top 2 components from PCA in an LDA model (PCA-LDA2; red), in the training and test data set. (e) Correlations to histology of conventional parameters (top), LDA scores from conventional parameters (ROI-LDA; top), the first component from the PCA (bottom), and the LDA scores from top 16 PCA components (PCA-LDA1) and top 2 PCA components (PCA-LDA2) (bottom). These are shown as absolute measurements, and not percent change from baseline.

