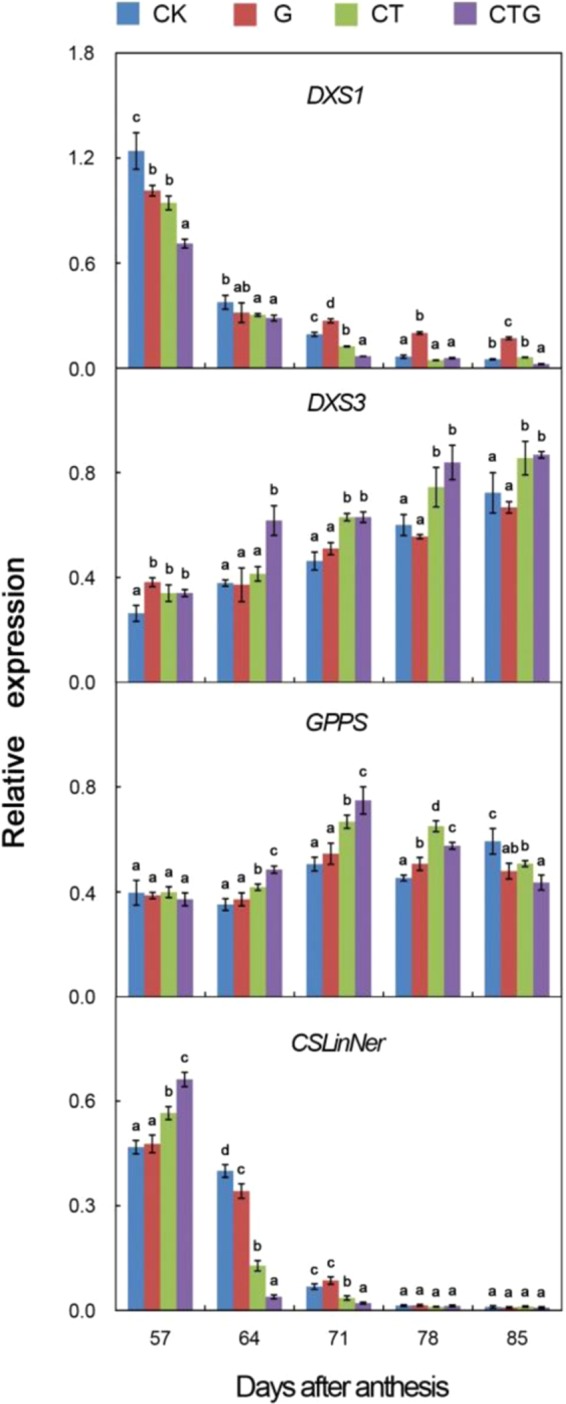
Figure 1.

Expression levels of genes involved in monoterpene biosynthesis. CK, the control treatment (unthinned and ungirdled); G, trunk girdled one week before véraison; CT, 50% clusters thinned one week before véraison; CTG, 50% clusters thinned and trunk girdled one week before véraison. Data are mean ± SE of three biological replicates. Different letters on bar chart denotes statistical significance values (p < 0.05) according to Duncan’s test.
