Figure 3.

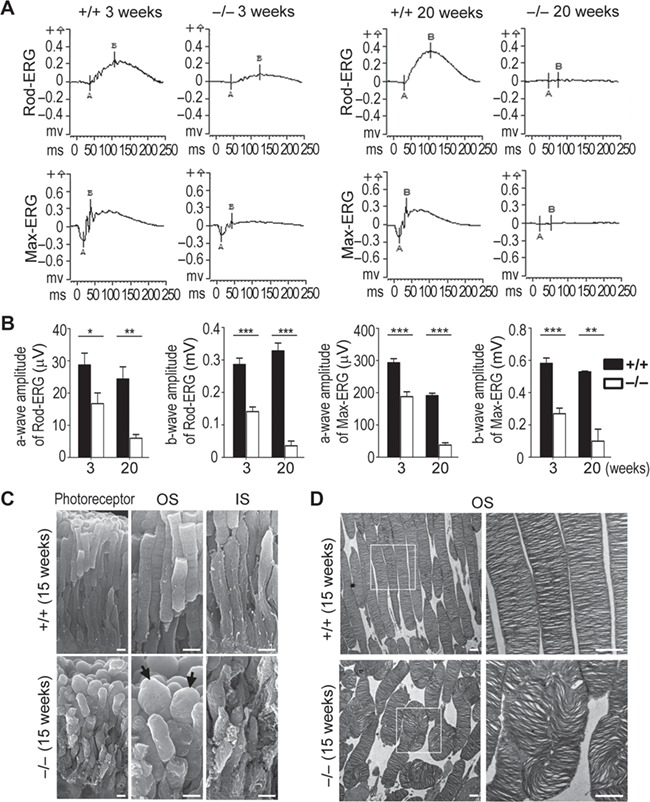
Decreased ERG response and deteriorated photoreceptor in Hsp90α-deficient mice. (A) ERG was recorded for Hsp90α-deficient mice or their wild-type littermates at postnatal 3 and 20 weeks. The rod-ERG and max-ERG were recorded in order. (B) Statistical analysis of ERG amplitudes. The amplitudes of a-wave and b-wave of rod-ERG and max-ERG were analyzed. Data are mean ± SEM of the results obtained from 10 mice at the age of 3 weeks and 3 mice at 20 weeks for each group. Student’s t-test, *P < 0.05, **P < 0.01, ***P < 0.001. (C) SEM observation of deformed photoreceptors in 15-week Hsp90α-deficient mice. The black arrows point to the bulged OSs in Hsp90α-deficient mice. Scale bar, 2 μm. (D) TEM observation of OS discs in photoreceptors of 15-week Hsp90α-deficient mice. The boxed areas are enlarged to show details. Scale bar, 1 μm.
