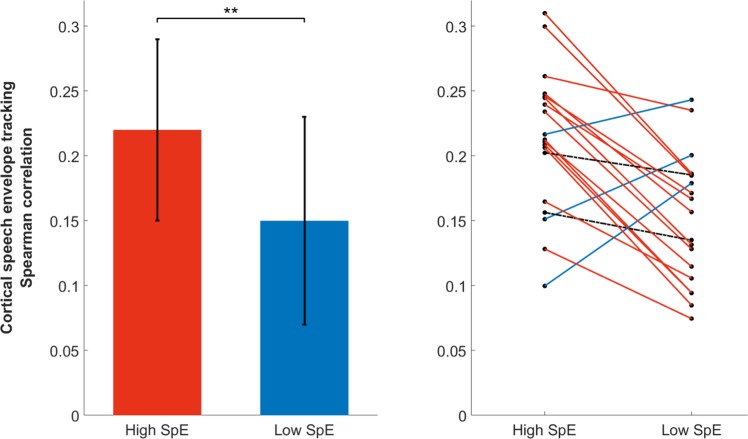
Figure 2.
Group (left) and individual (right) Spearman correlation using only periods of high (high SpE) or low (low SpE) attention on the computation of the decoder (median ± iqr). Note that more than 80% of the group showed higher correlation using a decoder based on periods of high attention than low attention. Each dot represents the cortical speech tracking for a participant (i.e., the cortical speech tracking averaged over folds). For each fold, the cortical speech tracking is computed over a complete testing period (i.e., 4-minutes of data). This means that each Spearman correlation value is computed by comparing 61440 data points (i.e., 4 × 60 × 256) of the actual and reconstructed speech envelope. All the correlations are significant (a permutation test was used to evaluate the significance level for each model, which was at around 0.03 for each participant).

