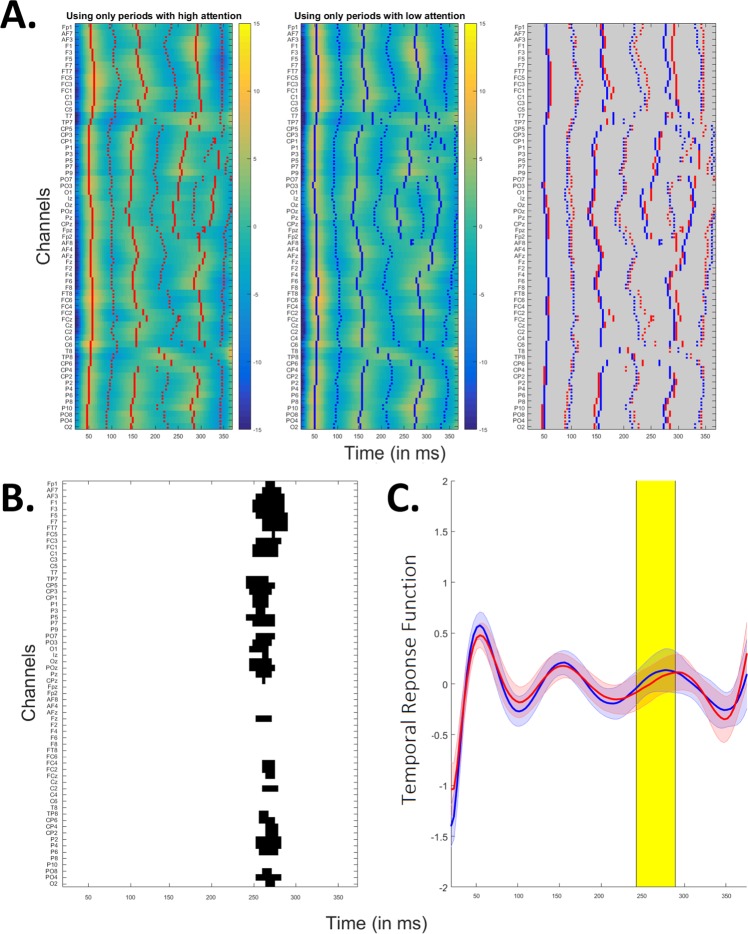
Figure 4.
Panel A: Temporal response function using periods of high (left panel) or low (center panel) attention for training the model. In red/blue, the peaks are indicated. In the right panel, peaks from the two different conditions are overlaid. Note the delay in later latencies (between 100 and 350 ms) observed in the frontal and fronto-central electrodes, while earlier and later latencies did not show any delay in the activations. Panel B: Temporal response function’s differences at each latency. Channels and latencies that were found to contribute significantly to this difference in a cluster-based analysis are indicated in black. Panel C: Temporal response functions using periods of high (red) or low (blue) attention for training the model averaged over electrodes. The TRFs are significantly different, and the difference is most pronounced from 242 to 290 ms (in yellow). The difference mainly results from the peak’s delay and not the peak’s amplitude change.

