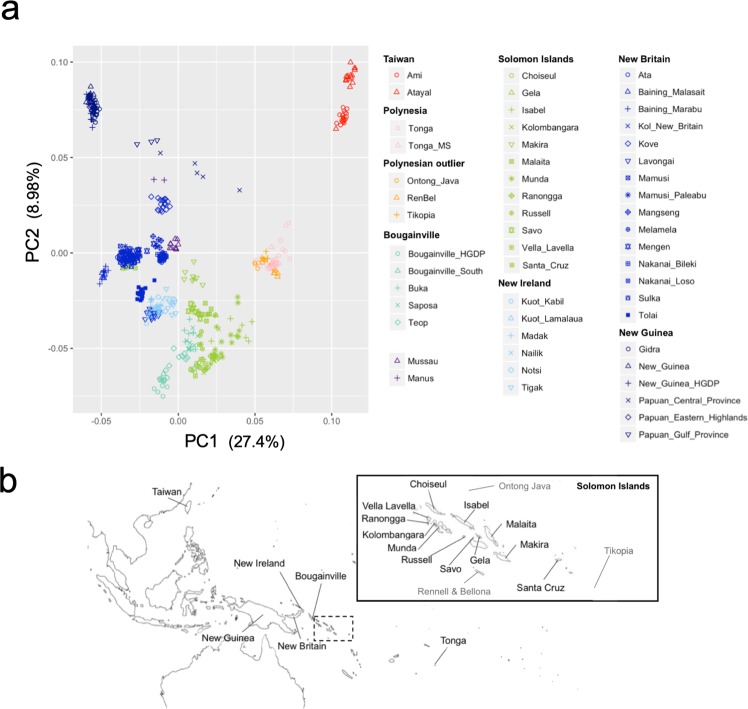
Figure 1.
PCA plot for 52 Oceanian populations and two Aboriginal Taiwanese populations (a) and geographic locations of Oceanian populations (b). (a) Each dot represents an individual. The yellow green color labels indicate populations in the Solomon Islands. Munda subjects gather in a cluster with other subjects in the Solomon Islands except for Santa Cruz. The eigenvalues and percentages of variance were 27.4 and 5.08% for PC1 and 8.98 and 1.66% for PC2. (b) Populations written in gray in the map of the Solomon Islands were Polynesian outliers.

