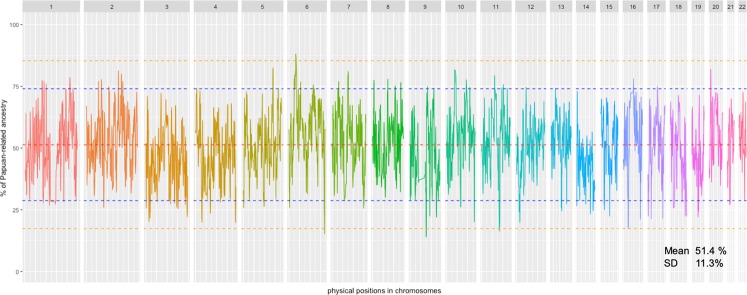
Figure 3.
Average Papuan-related ancestry estimated using ELAI across Munda genomes for each genomic position of each autosomal chromosome. Each color represents different chromosome. In this analysis, Gidra and CHB populations were used as proxies for Papuan-related and Asian-related ancestries in Munda subjects. Red dashed line represents the genome-wide mean. Blue and orange dashed lines represent ±2 SD and ±3 SD from the mean, respectively. The genome regions above the upper orange line and below the lower orange line were regarded as the high Papuan- and Asian- related ancestries regions, respectively.

