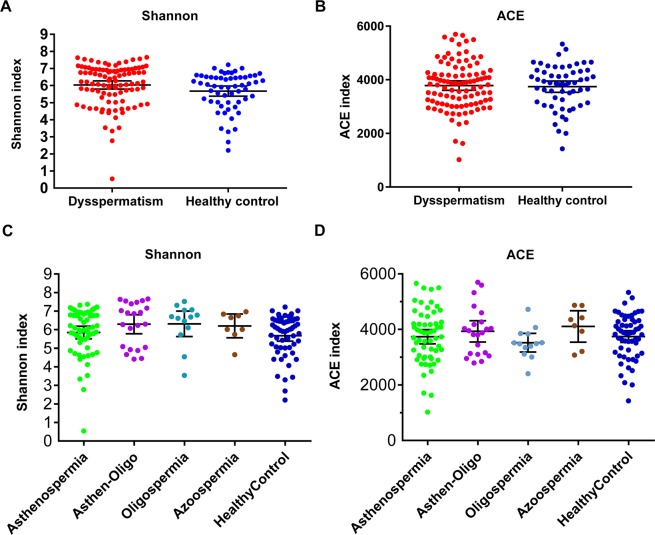
Figure 2.
Comparison of alpha diversity and relative abundance at phylum level based on the OTUs profile. Box plots depict differences in microbiome diversity based on (A) Shannon index and (B) ACE index between patients with dysspermatism and healthy controls. (C,D) show Shannon index and ACE index among patients with asthenospermia, oligospermia, oligoasthenospermia, and azoospermia, and healthy controls. The p value was calculated using the Wilcoxon rank-sum test.

