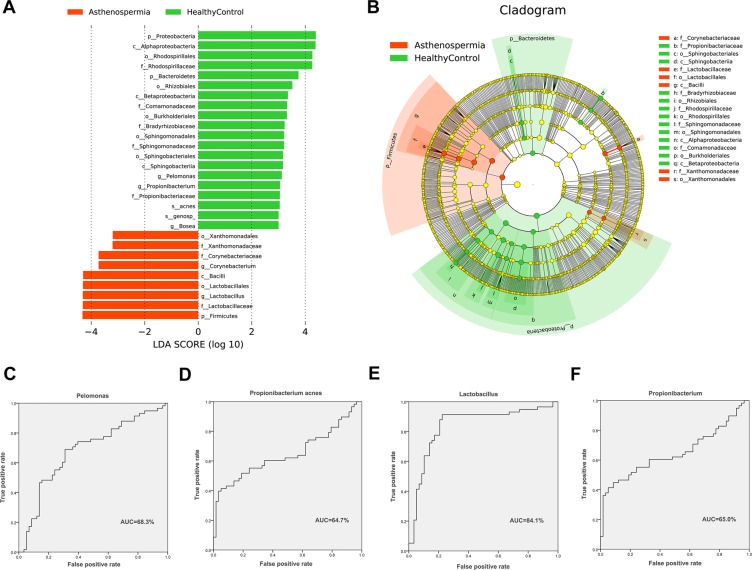
Figure 5.
LEfSe analysis between patients asthenospermia and healthy controls. (A,B) Comparison of the most differentially abundant taxa between patients with asthenospermia and healthy controls (LDA score above 3) generated using LEfSe analysis. We selected 4 biomarkers to predict the probability of patients with asthenospermia. (C–F) These biomarkers are Propionibacterium, Pelomonas, Lactobacillus, and Propionibacterium acnes. The ROC curves as well as the AUC (Area Under the Curve) values were calculated using SPSS.

