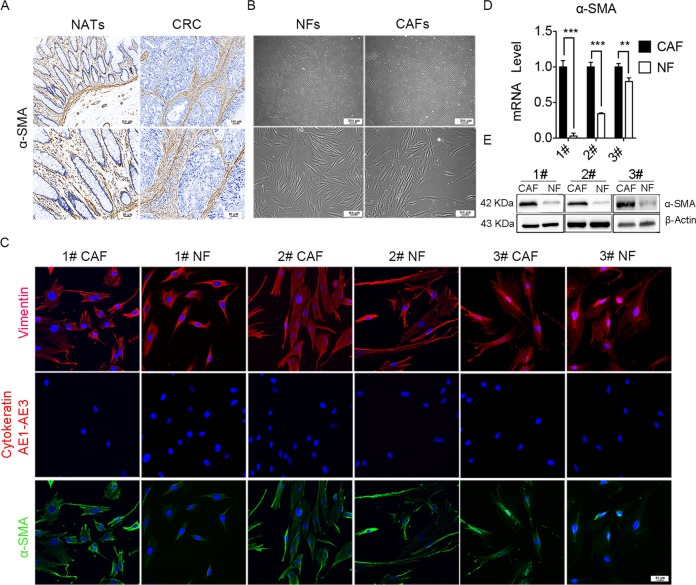
Fig. 1. Characterization of primary NFs and CAFs.
a The expression of α-SMA in CRC tissues were assayed by immunohistochemistry staining, indicating that CAFs were abundant in CRC tumor stroma (up panels scale bars, 100 µm; down panels scale bars, 50 µm). b The morphological images of NFs and CAFs (up panels scale bars, 200 µm; down panels scale bars, 100 µm). c Representative immunofluorescence images of CAFs and NFs that was immunostained for nucleus (blue), Vimentin (red, the first row), Cytokeratin AE1–AE3 (red, the second row), and α-SMA (green, the third row). Scale bars, 50 µm. d The mRNA level of α-SMA in NFs and CAFs by qRT-PCR; n = 3 (replicating from three patients); ***p < 0.001; **p < 0.01. e The protein expression of α-SMA in NFs and CAFs derived from three patients were analyzed by western blot analysis.

