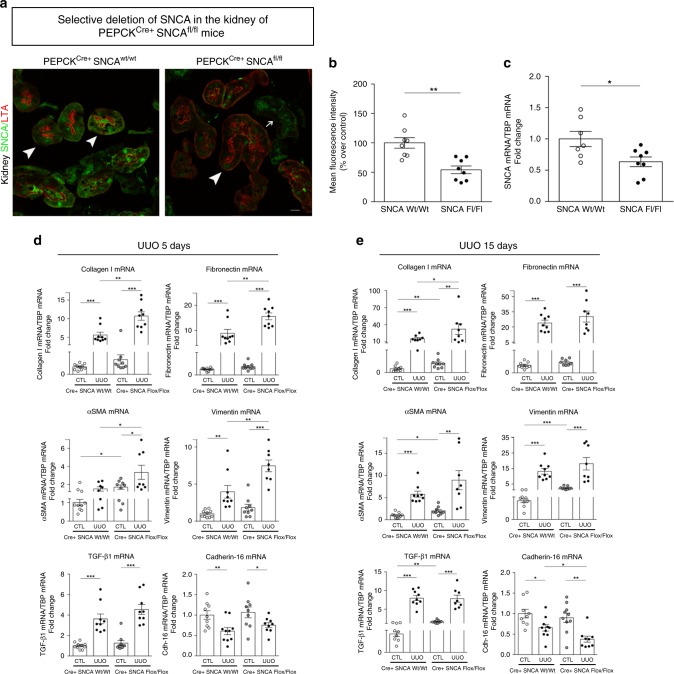
Fig. 6. RPTEC-SNCA deletion accelerates the profibrotic gene expression after UUO.
a Specificity of SNCA knockdown in renal proximal tubular epithelial cells was confirmed by double immunofluorescence staining of SNCA (green) with lotus tetragonolobus agglutinin (LTA, red) in PEPCKCre+ SNCAwt/wt and PEPCKCre+ SNCAfl/fl mouse kidneys at baseline. LTA is a marker of RPTECs and no difference in its expression was observed between WT and Flox mice (thick arrows, LTA-positive tubules; thin arrow, LTA-negative tubules). SNCA expression on RPTECs of PEPCKCre+ SNCAfl/fl mice was dramatically reduced, and nearly absent in some areas. Representative images are shown for each genotype. Scale bar represents 10 µm. b Quantification of SNCA positively stained areas of proximal tubules from PEPCKCre+ SNCAwt/wt and PEPCKCre+ SNCAfl/fl mouse kidneys at baseline. Data are presented as mean ± SEM (n = 8 mice/group) (% over control). c Total mRNA was extracted from kidneys of PEPCKCre+ SNCAwt/wt and PEPCKCre+ SNCAfl/fl mice. mRNA levels of SNCA were determined by quantitative real-time PCR and normalized to TBP. Data are presented as mean ± SEM (n = 8 mice/group). d–e Total mRNA was extracted from contralateral non-obstructed (CTL) and obstructed (UUO) kidneys of PEPCKCre+ SNCAwt/wt and PEPCKCre+ SNCAfl/fl mice 5 days (d) and 15 days (e) after UUO. mRNA levels of collagen I, fibronectin, α-SMA, vimentin, TGF-β1, and cadherin-16 were determined by quantitative real-time PCR and normalized to TBP. Data are presented as mean ± SEM (n = 10–15 mice/group). *p < 0.05, **p < 0.01, ***p < 0.001. The p-value by two-tailed Student's t-test (b, c) or two-way ANOVA (d, e). RPTEC—renal proximal tubular epithelial cell. Source data are provided as a Source Data file.

