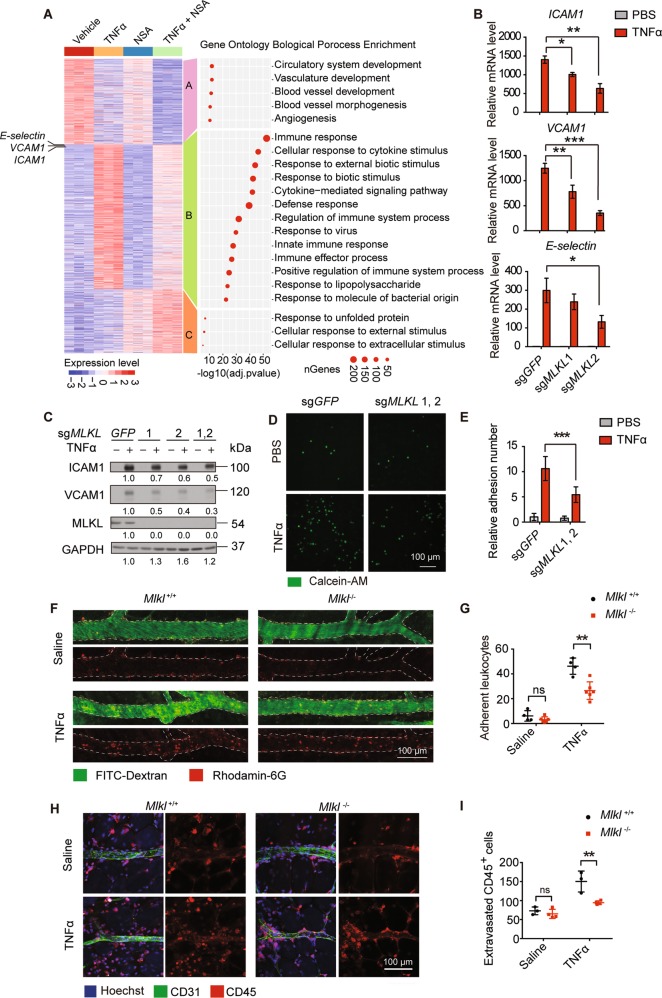
Fig. 2. MLKL regulates adhesion molecules expression as well as EC-leukocyte interaction.
a Heatmap of normalized expression dynamics of top 2000 DEGs in vehicle and TNFα, NSA, or TNFα + NSA treated cells. K-means clustering analysis identified three clusters of DEG according to their expression patterns. Left panel shows the gene ontology biological process analysis of the three DEG clusters (n = 3 biological triplicates). b, c Control or MLKL knockout HUVEC were stimulated with TNFα (50 ng/ml) for 6 h. Expression levels of adhesion molecules were determined by real-time PCR (b) and immunoblot (c). d, e Control or MLKL knockout HUVEC monolayers were pretreated with TNFα (100 ng/ml) for 12 h, then incubated with calcein-AM-labeled iBMDM for 30 min and adherent iBMDM were imaged (d) and quantitated (e). Calcein-AM, green. Scale bar, 100 μm. f, g Mlkl+/+ (n = 3–4) and Mlkl−/− (n = 3–6) mice were intradermally injected with 100 ng TNFα (in 50 μl saline) into the right side of abdominal skin to induce local inflammation, with the same volume of saline injected into the left side as control. Four hours later, the leukocytes (rhodamine-6G+) that adhered to the vessel wall were imaged by intravital confocal microscopy (f) and quantitated (g). Vessel were visualized with FITC-Dextran. h, i Eight hours after TNFα injection, the extravasated leukocytes were imaged (h) and quantitated (i). Leukocytes were stained with CD45 antibody and endothelial cells were stained with CD31 antibody. Data shown in Scale bar, 100 μm. Data (b–e) are representative of three independent experiments, with each experiment containing biological triplicates. Mean ± SD; *P < 0.05, **P < 0.01, ***P < 0.001; ns, not significant; Student’s t test.

