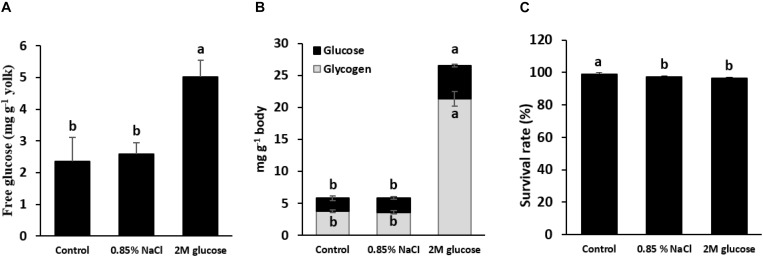
FIGURE 2.
Glucose content in the yolk reserves of alevins and their subsequent bodily glucose and glycogen content. (A) Glucose levels in the yolk of alevins that were microinjected with saline (0.85% NaCl) or glucose (2 M), as well as the control (non-injected alevin). Note that fish alevins were sampled for examination of the glucose level in the yolk sac immediately after injection. At 1 wpi, the glucose content and glycogen content were examined in the bodies of larvae injected with saline (0.85% NaCl) and glucose (2 M) and in the control (non-injected) larvae (B), and their survival rates were determined (C). Different letters in the bar graph indicate significant differences (P < 0.05).

