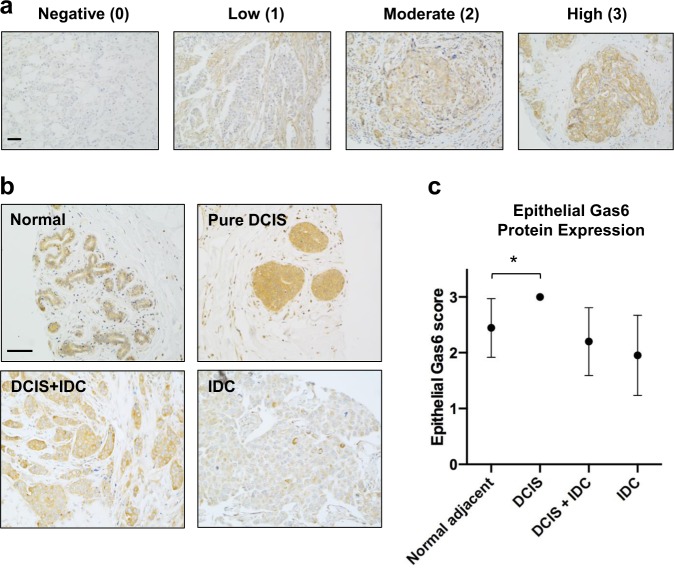
Fig. 1. Gas6 expression in normal breast and invasive breast cancer.
a Representative images of epithelial Gas6 staining and the corresponding score assigned as negative (0), low (1), moderate (2), or high (3). b Immunohistochemical analysis of Gas6 in normal breast tissue and different stages of cancer, showing the localization and the differential expression of Gas6. c Graph depicts epithelial Gas6 score in the epithelium of normal breast and different stages of breast cancer (normal: n = 9, pure DCIS: n = 12, DCIS/IDC: n = 44, IDC: n = 144). Error bars are SEM, *p = 0.008 (Chi-squared test). Scale bars = 100 μm.

