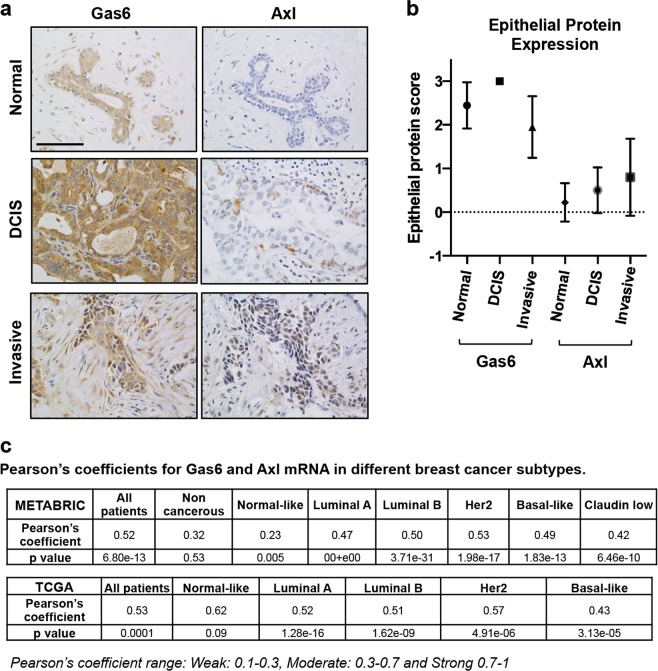
Fig. 3. Differential expression of Gas6 and Axl.
a Images depict immunohistochemical staining using antibodies to Gas6 or Axl in normal (n = 9), DCIS (n = 12) and invasive ductal carcinoma (n = 100) from the same patients. Scale bar = 100 μm. b Graph shows quantitation of Gas6 or Axl staining represented by score (0–3) in normal, DCIS and invasive breast tissues. Error bars are SEM. c Tables represent Pearson’s coefficients, and the corresponding p value, between Gas6 mRNA, and Axl mRNA in METABRIC and TCGA data sets, using either all patients data or PAM50-classfied subtypes.

