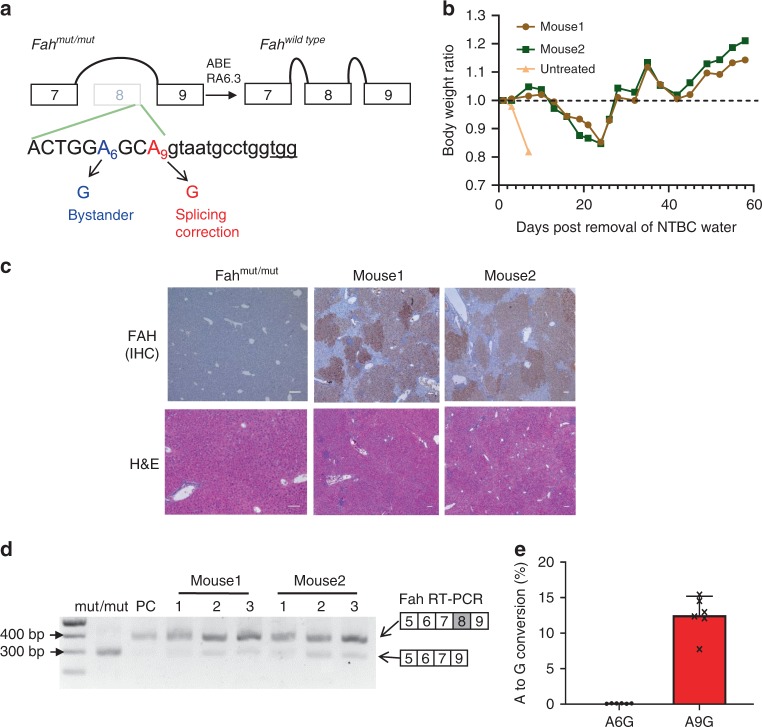
Fig. 3. Nanoparticle delivery of ABE mRNA to correct Fah splice-site mutation in vivo.
a Diagram of Fah splicing before and after correction by RA6.3. Protospacer sequence is shown below. Exon sequence is in upper case and intron sequence is in lower case. Target “A” is red and bystander “A” is blue. PAM sequence is underlined. b Tracking mice body weight ratio after removal of NTBC water. Body weight ratio is calculated over the body weight at day 0 of NTBC removal. c Immunohistochemistry staining and Hematoxylin and Eosin staining (H&E) of mouse liver sections. Mouse 1 and 2 denotes mice treated with LNP-5moU-6.3 and LNP-sgFah (end point 58 days). Untreated Fah mut/mut mouse was kept on NTBC water. Scale bar = 100 µm d RT-PCR results from treated mouse liver. PC (positive control) indicates samples from mouse treated with plasmids-delivered ABE and guide RNA through hydrodynamic injection. Three liver lobes (as 1, 2, and 3) per mouse were collected and analyzed. Wildtype Fah amplicon is 405 bp and mutant Fah (lacking exon 8) is 305 bp. e A-to-G conversion rate at Fah gene locus in mice livers. Three liver lobes per mouse were collected and analyzed. A6G/A9G indicates editing efficiency at bystander/target “A” sites. Data represent mean± SD (n = 6). Source data are provided as a Source Data file for b, d, e.

