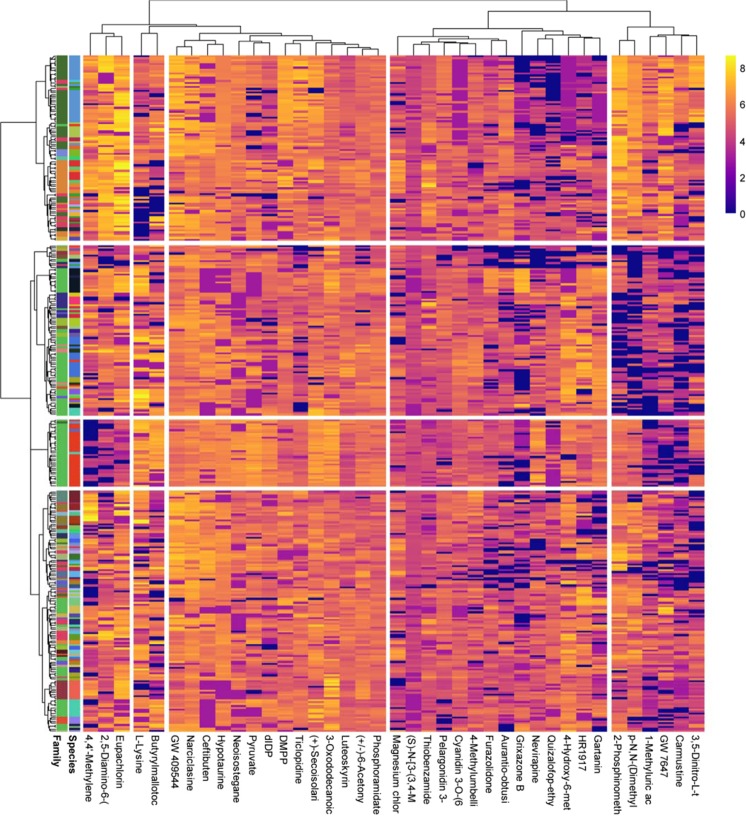
Figure 2.
Heatmap-clustering analysis of the metabolites identified in the foliar metabolomes of families and species. The metabolites were identified/assigned based on the KEGG database or our library. Family and each species generally clustered together with the corresponding metabolites. The samples are represented horizontally, and the metabolites are represented vertically on the heatmap. Abundance is represented by the intensity of the color of each metabolite, with blue representing low abundance and yellow representing high abundance. The 50 most important metabolites that were differentially affected (P < 0.05) between species and family are represented.

