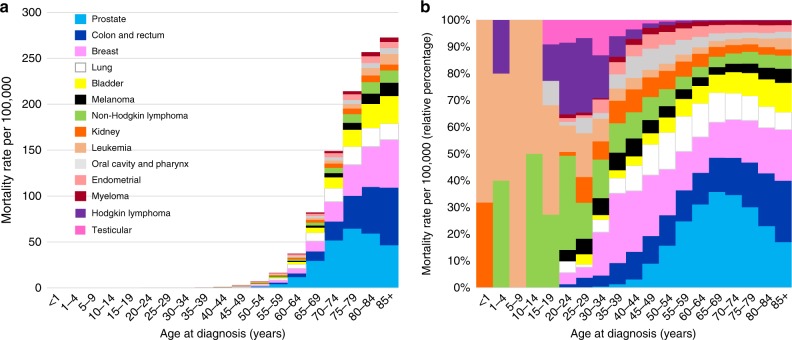
Fig. 2. Age adjusted mortality rates per 100,000 for fatal heart disease by cancer subsite.
a The y-axis depicts the heart disease-specific mortality rate per 100,000 and the x-axis depicts the age group at diagnosis in years. The colors depict the disease sites as follows: light blue = prostate; dark blue = colon and rectum; pink = breast; white = lung; yellow = bladder; black = melanoma; green = non-Hodgkin lymphoma; orange = kidney; light orange = leukemia; gray = oral cavity and pharynx; coral = endometrial; maroon = myeloma; purple = Hodgkin lymphoma; dark pink = testicular. The plurality of fatal heart disease occurs in patients diagnosed with cancer of the prostate, colon and rectum, breast, and lung, and the majority fatal heart disease cases are diagnosed at an older age. b The y-axis depicts the relative heart disease-specific mortality rate per 100,000 compared to all cancer patients, and the x-axis depicts the age group at time of diagnosis. For each age group, heart disease-specific mortality rates are displayed as a relative percentage to other cancer sites in that specific age group. The colors depict the disease sites. For patients under age 40, the plurality of heart disease deaths occurs in patients treated for breast cancer and lymphomas. In contrast, among patients ≥40 years old, the plurality of heart disease deaths occurs in patients treated for cancers of the prostate, breast, and colon and rectum. Source data are provided as a Source Data file.

