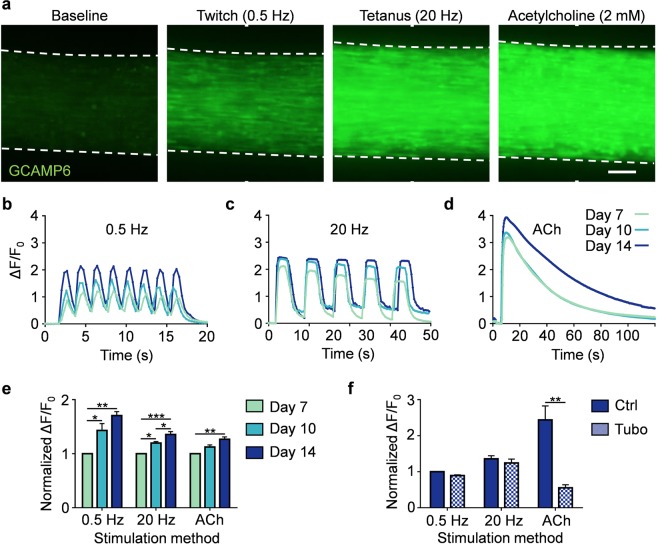
Figure 4.
MyoTACTIC enables non-invasive and in situ measurement of hMMT calcium transients. (a) Representative epifluorescence images of the peak GCaMP6 signal from hMMTs in response to low frequency (0.5 Hz, twitch contraction), high frequency (20 Hz, tetanus contraction) and acetylcholine (ACh, 2 mM) stimulations at Day 14 of differentiation. Scale bar 200 µm. (b–d) Representative calcium transient traces of hMMTs at Day 7, 10, and 14 of differentiation in response to (b) low and (c) high frequency electrical and (d) acetylcholine stimulations. (e) Bar graph quantification of hMMTs calcium transients in response to electrical (0.5 and 20 Hz) and biochemical (ACh) stimuli at differentiation Day 7, 10 and 14. Values are normalized to the Day 7 results for each stimulation modality. *p < 0.05; **p < 0.01, ***p < 0.001 (n = minimum of 9 hMMTs from 3 muscle patient donors per time point, per stimulation method). (f) Bar graph quantification of calcium transients in hMMTs activated with electrical or biochemical stimuli following pre-treatment with d-tubocurarine (25 µM) at Day 14 of differentiation. Values are normalized to control (Ctrl) hMMTs stimulated with 0.5 Hz electrical stimuli. **p < 0.01 (n = 9 hMMTs from 3 muscle patient donors per treatment condition per stimulation method). In (e,f) values are reported as mean ± SEM. Significance was determined by two-way ANOVA followed by Tukey’s and Sidak’s multiple comparisons to compare differences between groups in (e) or t-test in (f).

