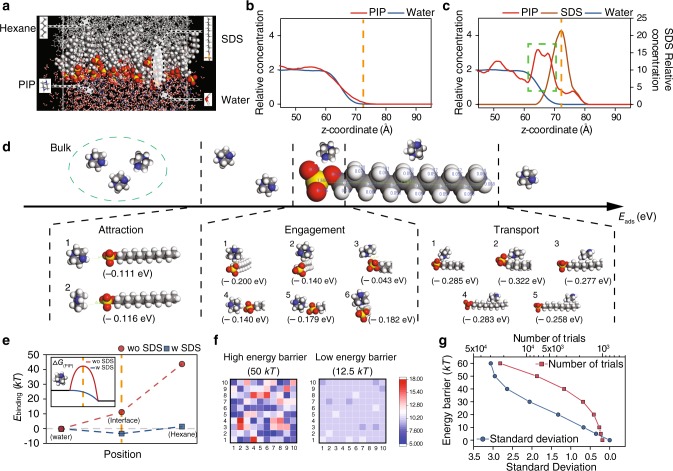
Fig. 3. Facilitated trans-interface transport of PIP in SARIP.
a A snapshot of the water/hexane interface in the MD simulation (Supplementary Fig. 6). b Relative abundance of PIP (red curve) and water (blue curve) across the interface (at ~70 Å, orange dashed line) in the absence of SDS. c Relative abundance of PIP (red curve), water (blue curve), and SDS (brown curve) across the interface (orange dashed line). SDS molecules accumulate at the interface and attract the PIP molecules. d DFT simulation of the potential energy for interaction between a PIP molecule and an SDS molecule (with multiple configurations) at different interaction stages including attraction, engagement, and transport. e MD simulation of the binding free energy (Ebinding) with the PIP molecule at different locations (Supplementary Fig. 8). The MD simulations were performed with (blue squares) and without SDS (red circles). Inset: schematic illustration of how the Gibbs free energy barrier is reduced by the presence of SDS. f Monte Carlo simulation of particles with distributed energy passing through a 10 × 10 grid. The energy of the particles follows a Maxwell-Boltzmann distribution at 298 K. The color map represents the numbers of particles passing through different pixels (according to the scale bar) with an energy barrier of 50 kT (left) and 12.5 kT (right). g The total diffusion attempts (red squares and curve) and the standard deviation (blue circles and curve) of the spatial distribution of successful passages for 1000 particles passing through a 10 × 10 grid as functions of the free energy barrier.

