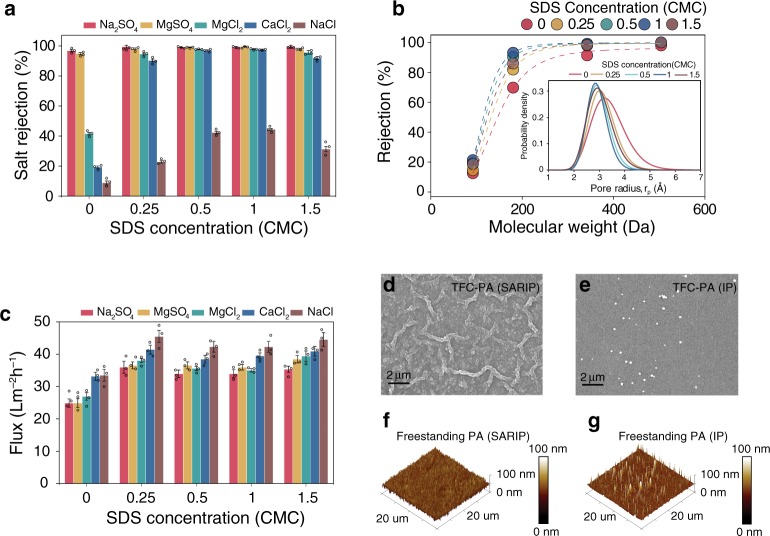
Fig. 4. Concentration-dependent performance and active layer morphology.
a–c Impacts of SDS concentration on the performance and properties of the TFC-PA membranes, including a rejection of various salts; b rejection of uncharged model solutes including raffinose, sucrose, glucose, and glycerol. Inset: pore size distribution of PA active layers derived from rejection curves of uncharged solutes (Supplementary Table 20); and c water flux. The hydraulic pressure was 4 bar and the salt concentration in the feed solution was 1000 ppm. d, e SEM images of the surface of TCF-PA membranes obtained using SARIP and conventional IP performed on a PES support, respectively; f, g AFM topography of free-standing PA films from SARIP and conventional IP, respectively. The free-standing films were fabricated without support and then transferred to silicon wafers. The error bars represent the standard deviation of data from three replicate measurements.

