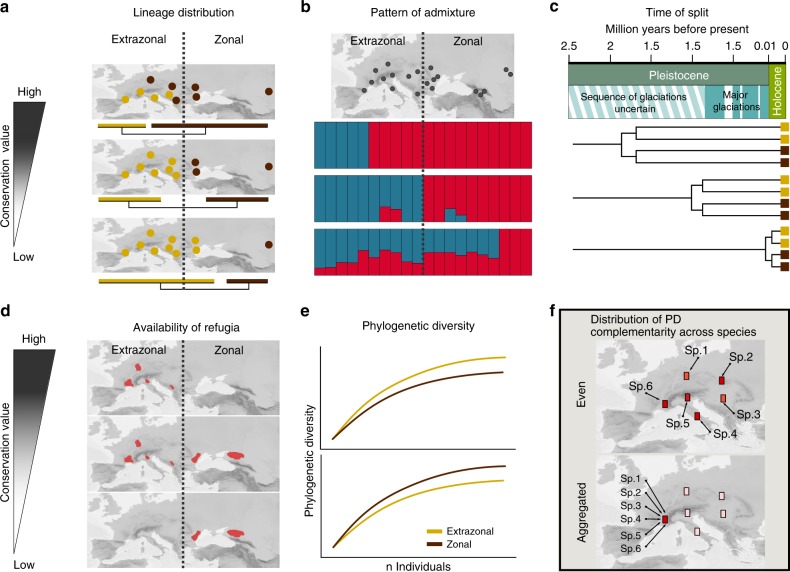
Fig. 2. Criteria chosen to evaluate the conservation value of biota of European extrazonal steppes.
a Distribution of lineages throughout zonal and extrazonal steppes; populations illustrated as circles, colours represent origin of populations (yellow: extrazonal lineage, brown; zonal origin). b Geographic distribution of observed gene pools and admixture between them. c Time of lineage divergence (colour scheme as in (a)). d Geographic position of refugia. e Phylogenetic diversity (yellow line: extrazonal, brown line: zonal). f Distribution of phylogenetic diversity complementarity (PD complementarity) across species (Sp.1–6) in the extrazonal steppes: even distribution of PD complementarity across species versus spatial aggregation of PD complementarity across all species in a single area (dark red: large value, light red: small value); the scale indicating conservation value does not apply in this figure panel.

