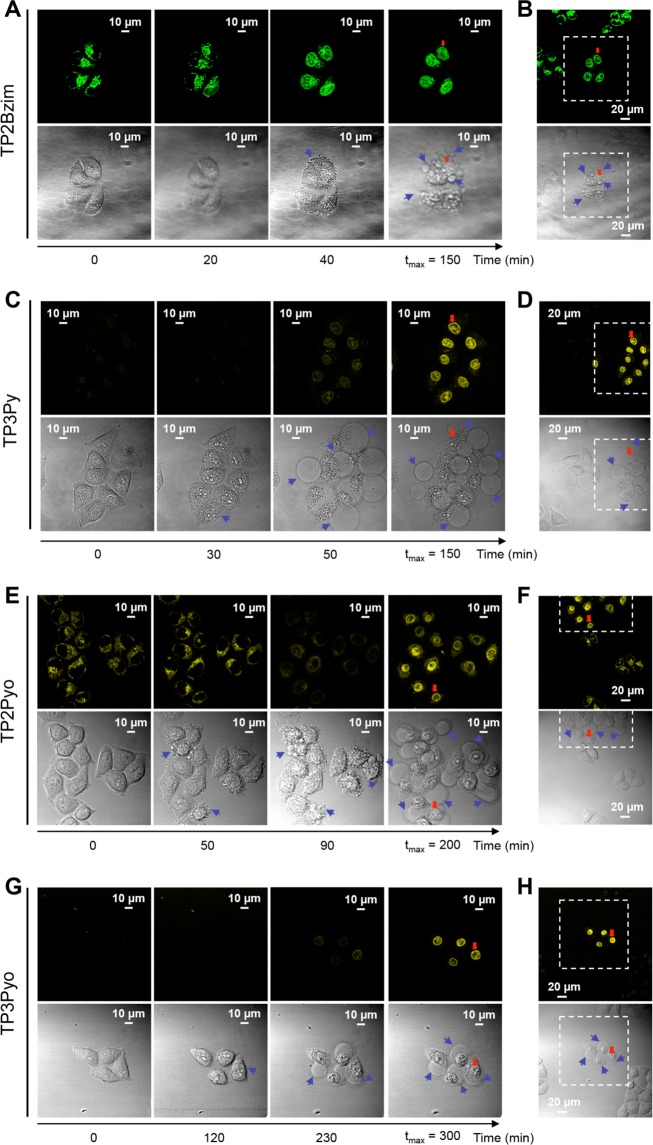
Figure 2.
Confocal fluorescence imaging of TPA-treated living cells upon prolonged visible light irradiation. HeLa cells were pre-incubated with 2-µM TPA (A,B: TP2Bzim; C,D: TP3Py; E,F: TP2Pyo; G,H: TP3Pyo) for 2 h at 37 °C before continuous irradiation (458 nm; irradiance, 30 mW/cm2) (see Methods for emission slit settings). For each compound, the image series show observations at four relevant times (a more complete view is shown in Supplementary Fig. S1): the initial observation (time 0), the beginning of the nuclear translocation of TPA fluorescence, the appearance of plasma membrane blebs (indicated by blue arrows in DIC – differential interference contrast – transmission images) and the time of maximum fluorescence intensity in nuclei (tmax). Enlarged field of observation is shown at tmax for each TPA (panels B, D, F, H), showing that only cells illuminated at t = 0 are characterized by both TPA nuclear translocation and membrane blebbing. Cells outside the irradiated area (delineated by dashed lines) display normal morphologies and cytoplasm-located fluorescence. Cells indicated by a red arrow serve as a landmark.

