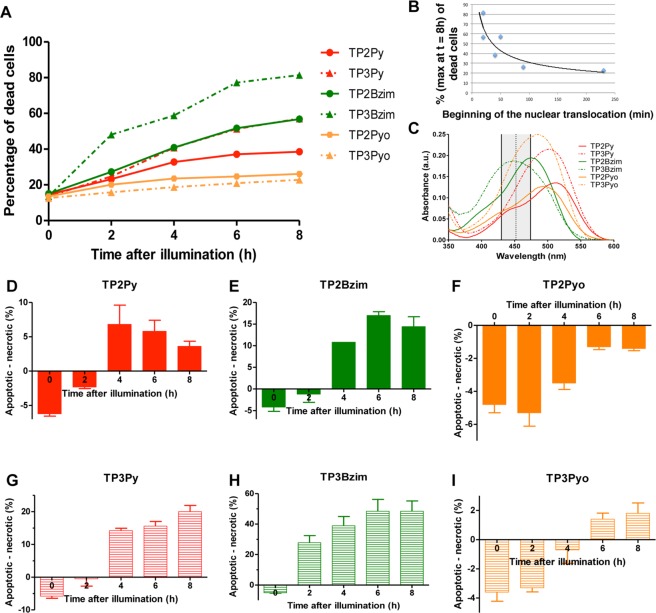
Figure 5.
Flow cytometric analysis of apoptotic/necrotic subpopulations of cells upon TPA treatment and light illumination. Living Jurkat cells were pre-treated with 2-µM TPA for 2 h and subjected to light illumination (5 mW.cm−2) for 30 min (Mercury lamp: 130 W; 380–600 nm + filter: 452 ± 22.5 nm). Treated cells were then incubated for various times in the dark at 37 °C before Annexin V/DAPI treatment and analysis. (A) Total percentages of dead cells (Annexin V+/DAPI+/−) as a function of time after illumination. The plot shows representative data of 3 independent experiments for each TPA. (B) Relationship between the maximum percentage of dead cells (at t = 8 h) and the beginning of TPA nuclear translocation (see Fig. 2). (C) Corresponding absorption spectra of TPAs (+DNA). Also shown is the transmission profile of the excitation filter (in grey) used in flow cytometry experiments. (D–I) Apoptotic cell subpopulation (Annexin V+/DAPI−) minus necrotic subpopulation (Annexin V+/DAPI+) for each TPA as a function of time after illumination (corrected by apoptotic/necrotic subpopulations measured in the absence of illumination). The bar graphs show mean ± SD values from 3 independent experiments. Related two-dimensional flow cytometry dot plots, control experiments (+/− TPA, + /− illumination) and kinetics of apoptosis/necrosis are shown in Supplementary Figs. S2, S3.

