Figure 6.
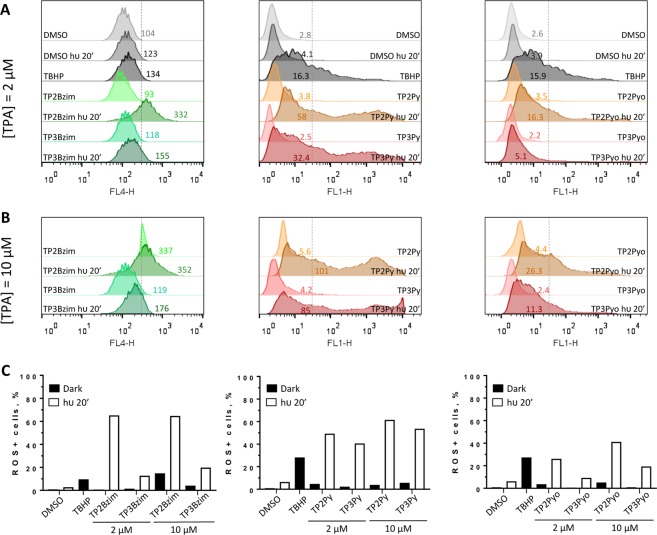
Flow cytometric analysis of intracellular ROS detection upon TPA photoactivation. (A-B) modal representations of the number of cells as a function of the fluorescence emission intensity of ROS detectors. HeLa cells were treated with 2 µM (A) or 10 µM (B) of TPA compounds and then subjected or not to light irradiation for 20 min before treatment with either the ROS Deep Red dye (FL4 channel; left panel) or H2DCF-DA (FL1 channel; middle and right panels) (depending on the emission wavelength of TPAs) and flow cytometric analysis (see Methods). Cells treated with DMSO alone (1‰) +/− light or TBHP (100 µM) for 1 h were used as negative and positive controls, respectively. Light-treated samples are explicitly mentioned in figures (= hν 20’). The indicated numbers correspond to geometric mean values of fluorescence intensities. The vertical dotted lines represent the limits between negative and positive cells in terms of fluorescence (named thereafter L) by taking the “DMSO/dark” condition as a reference. The percentages of positive cells were estimated based on the L value (= [number of cells (fluorescence intensity> L)] × 100/[total number of cells]) and are shown in histograms (C).

