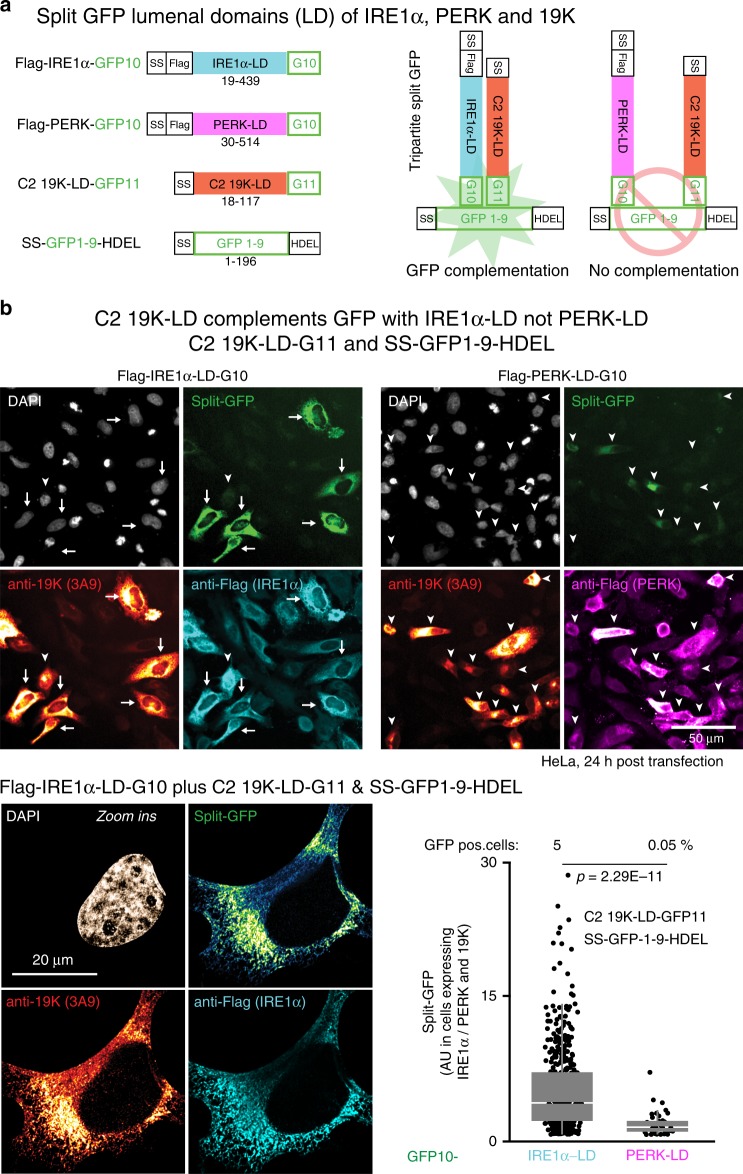
Fig. 4. 19K forms a complex with IRE1α in the ER.
a Schematic representation of tripartite split-GFP lumenal domain (LD) constructs used in ER-lumenal GFP complementations. Green fluorescence is restored when proteins containing the GFP10 and GFP11 domains are in close proximity together with the core GFP1–9 targeted to the ER lumen. b Interaction of C2 19K-LD with IRE1α-LD but not PERK-LD. HeLa cells co-transfected with C2 19K-LD-GFP11, SS-(signal sequence)-GFP1–9-HDEL, and Flag-IRE1α-GFP10 or PERK-LD-GFP10 were fixed and stained with anti-19K (3A9) and anti-Flag antibodies and DAPI (nuclei). Confocal images were segmented with CellProfiler using DAPI as a nuclear mask, and the reticular ER signal was measured in a ten-pixel area around the nuclei. Arrows indicate high-intensity split-GFP complementation signals in IRE1α-LD-transfected cells, and arrowheads low-intensity split-GFP complementation. Zoomed in representative immunofluorescence micrographs of split-GFP complementation in SS-GFP1–9-HDEL, IRE1α-LD-GFP10, and C2 19K-LD-GFP11-transfected cells. Cells were imaged with Leica SP8 microscope using Nyquist x–y–z sampling with ×63 objective. Following acquisition, images were deconvolved using SVI Huygens using theoretical point-spread function (PSF) automatically calculated from the imaging parameters. Split-GFP complementation signals appear in the region of ER tubules where 19K and IRE1α colocalize. Flag and 19K-positive cells (n = 492 for IRE1α-LD and n = 40 for PERK-LD) were plotted for GFP intensity, and the percentage GFP-positive cells is indicated. Data are presented as median with first and third quartiles, and whiskers as boxes and lines, respectively. Statistical tests were performed using Wilcoxon two-sided nonparametric test, and two independent experiments gave similar results (lower right panel).

