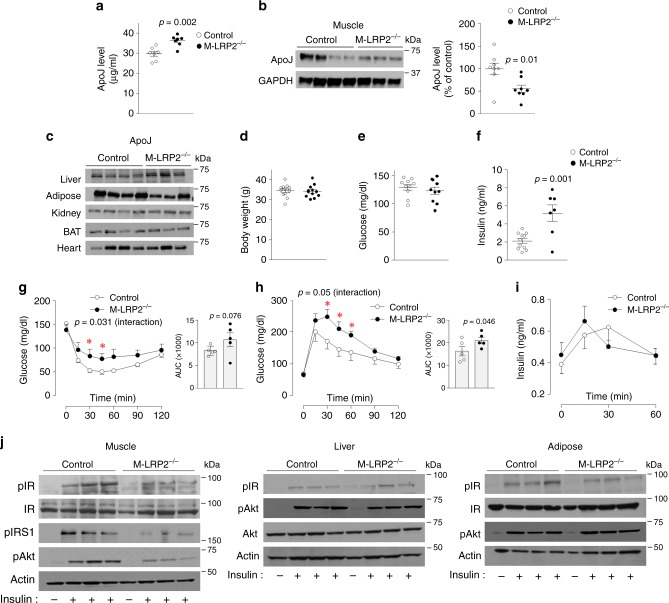
Fig. 5. LRP2 deletion in muscle increases circulating ApoJ and causes insulin resistance and glucose intolerance.
a ApoJ protein levels in serum of muscle-specific LRP2-deficient mice (M-LRP2−/−). Serum ApoJ levels were measured by ELISA. ApoJ, or ApoB 48 were visualized by immunoblotting. Scatter diagram shows densitometric quantitation of ApoJ protein from control and M-LRP2−/− mice (n = 7 per group). b ApoJ protein levels in muscle of M-LRP2−/−. Muscle lysates (20 μg) were separated by SDS–PAGE. ApoJ or GAPDH was visualized by immunoblotting. Scatter diagram shows densitometric quantitation of ApoJ protein from control and M-LRP2−/− mice (n = 8 per group). c ApoJ protein levels in multiple metabolic organs of M-LRP2−/−. Tissue lysates (20–50 μg) were separated by SDS–PAGE. ApoJ was visualized by immunoblotting. d Body weight (n = 12 per group), e random blood glucose (n = 10 per group), f serum insulin (n = 11 for control, n = 7 for M-LRP2−/−), g insulin tolerance test (ITT; n = 5 per group), h glucose tolerance test (GTT; n = 5 per group), i glucose-stimulated insulin secretion test (GSIS; n = 4 per group), and j insulin signaling (n = 4 per group) were measured in control and M-LRP2−/− mice. Serum and muscle ApoJ level, body weight, and random blood glucose were measured at 16 weeks of age. Serum insulin levels were measured from overnight fasted mice at 24 weeks of age. ITT was performed at 24 weeks of age and GTT was performed at 18 weeks of age. GSIS was performed at 22 weeks of age. Insulin signaling were performed at 24 weeks of age. All bars and errors represent means ± SEM. p values by two-sided Student’s t-test in a, b, and f, and by repeated measures two-way ANOVA in g and h are indicated. p values for AUCs were evaluated by one-sided Student’s t-test for g and h. p values for AUCs were evaluated by one-sided Student’s t-test for g and h. p values for interaction in g and h were obtained by Greenhouse–Geisser correction. *p < 0.05 vs control by repeated measures two-way ANOVA.

