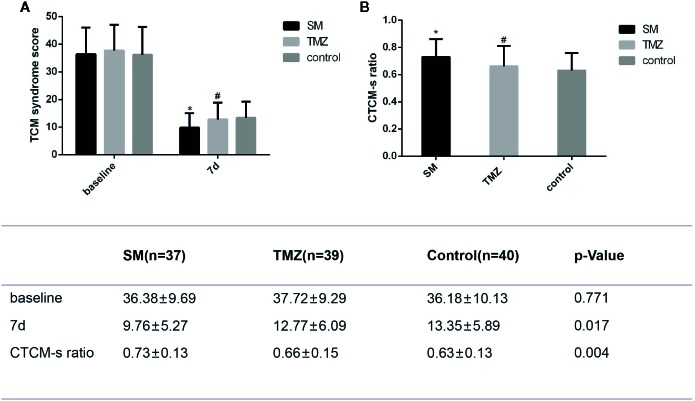
Figure 5.
The effects of the SM, TMZ, and control treatments on CTCM-s in patients with HF. (A) CTCM-s at baseline and after 7 days of treatment in the SM, TMZ, and control groups; *P <0.01 vs. the baseline of SM; #P < 0.01 vs. the baseline of TMZ; the control group (7 days), P < 0.01 vs. the baseline of control; *P < 0.01 and #P > 0.05 compared with the control group (7 days), *P < 0.05 compared with the TMZ group (7 days); (B) CTCM-s in the SM, TMZ, and control groups after 7 days; *P < 0.01 or #P > 0.05 vs. the control group (7 days); *P < 0.05 vs. the TMZ group (7 days). CTCM-s ratio= (baseline-7 days)/baseline.

