Figure 4.

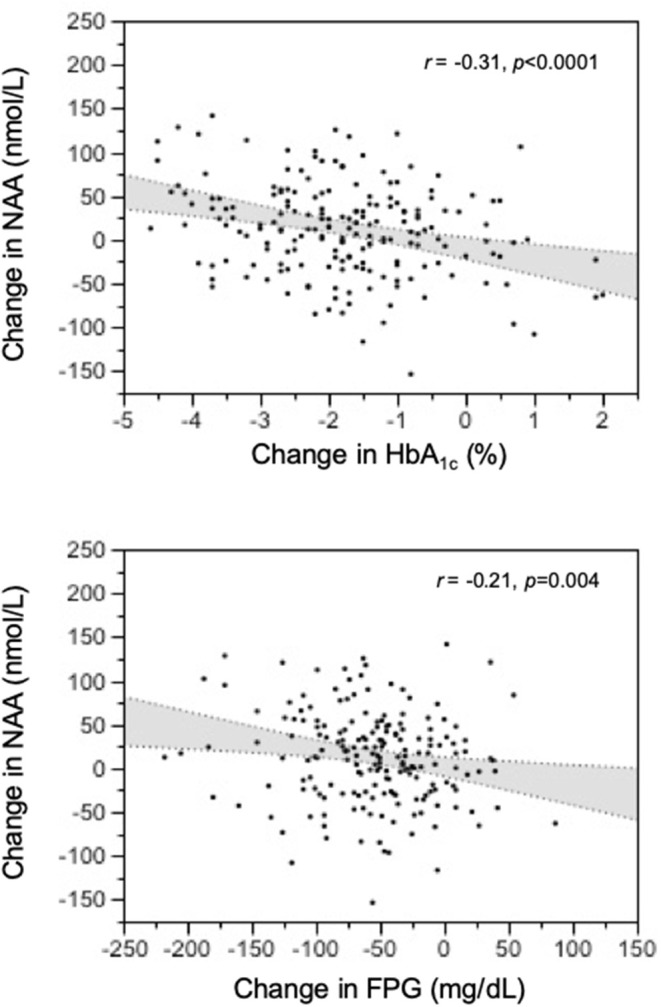
Relation of treatment-induced changes in plasma N-acetylaspartate (NAA) concentrations to the corresponding changes in HbA1c and fasting glucose levels at 1-year post-treatment.

Relation of treatment-induced changes in plasma N-acetylaspartate (NAA) concentrations to the corresponding changes in HbA1c and fasting glucose levels at 1-year post-treatment.