
Figure.
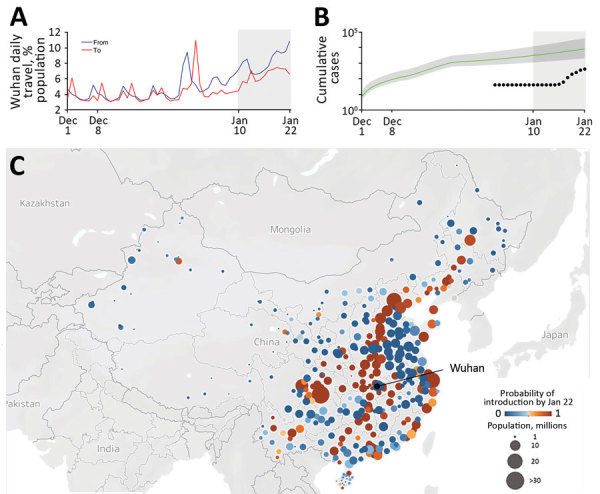
Risks for transportation of coronavirus disease (COVID-19) from Wuhan, China, before a quarantine was imposed on January 23, 2020. A) Daily travel volume to and from Wuhan, given as a percentage of the Wuhan population. Gray shading indicates the start of Spring Festival season on January 10, 2020, a peak travel period in China. B) Estimated and reported daily prevalence of COVID-19 in Wuhan. The green line and shading indicate model estimates of cumulative cases since December 1, 2019, with 95% credible interval bounds, assuming an epidemic doubling time of 7.31 days (95% credible interval 6.26–9.66 days). Black dots indicate cumulative confirmed case counts during January 1–22, 2020 (10). Gray shading at right indicates the start of Spring Festival season. C) Probability that >1 COVID-19 case infected in Wuhan traveled to cities in China by January 22, 2020. The 131 cities with a risk threshold >50% are indicated in shades of orange; 239 cities below that threshold are indicated in shades of blue. Map generated by using Mapbox (https://www.mapbox.com).