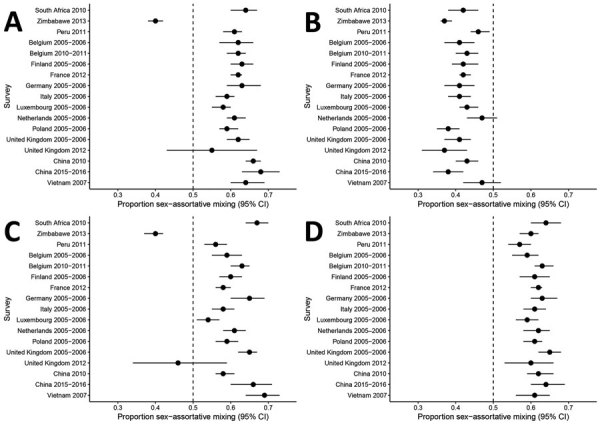
Figure 2.

Analysis of sex differences in social contact patterns and tuberculosis transmission and control showing proportion of contacts with the same sex as reported for A) boys with boys, B) boys with men, C) girls with girls, and D) girls with women. Forest plots of sex-assortative mixing in contacts show contacts (black dots) and 95% CIs (error bars) reported by boys (A, B) and girls (C, D) with children (A, C) and with adults (B, D).
