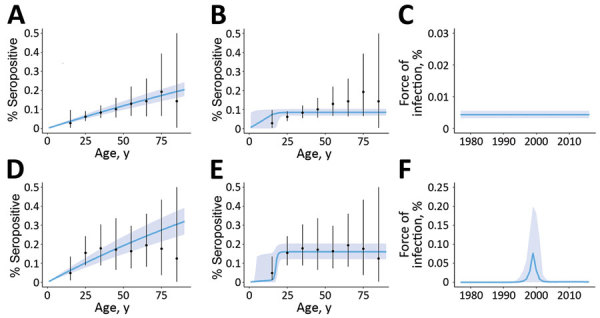
Figure 3.

Observed and predicted profiles for Zika virus seroprevalence by age, climatic zone, and the assumed mode of transmission, Mali. Observed age-specific seroprevalence mean (black dots) and range (error bars) are compared with predictions (blue lines) of models; shading indicates 95% CI. Panels A–C show data for tropical savannah and D–F for semiarid regions. Predictions assume a constant force of infection over time (A, D) or a single epidemic in the past (B, E). Force of infection is shown over time by the best fitting model for each climatic region (C, F).
