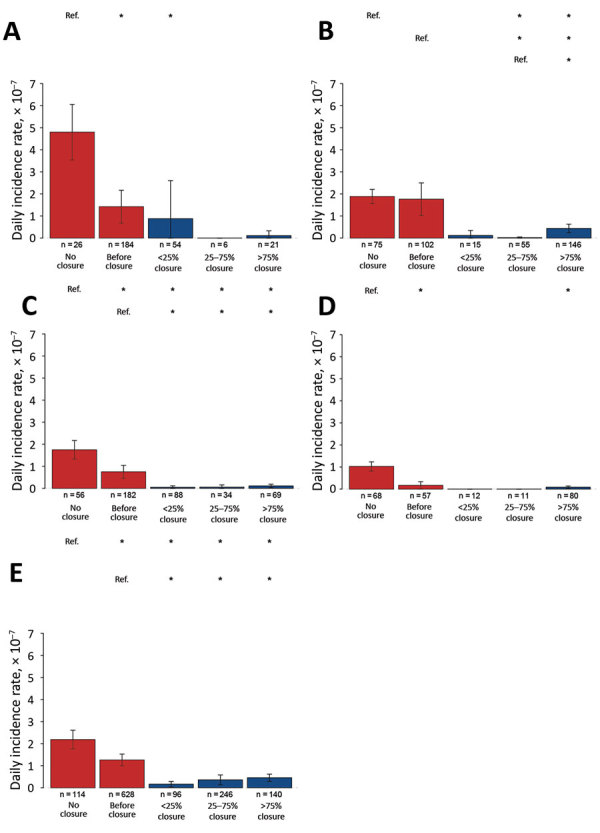
Figure 3.

Estimated daily incidence rates in counties with various levels of live poultry market (LPM) closures across waves of influenza A(H7N9) infections, by proportion of closure days during epidemic wave, China, 2013–2017. A) Wave 1; B) wave 2; C) wave 3; D) wave 4; E) wave 5. Error bars indicate 95% CIs. Asterisks (*) above bars indicate statistically significant (p<0.05) differences between daily incidence rates and reference category (Ref.) rates. Proportion categories: no closure; before closure, incidence rate before market was closed; <25%, closed <25% of the days of the wave duration; 25%–75%, closed 25%–75% of the days of the wave duration; >75%, closed >75% of the days of the wave duration.
