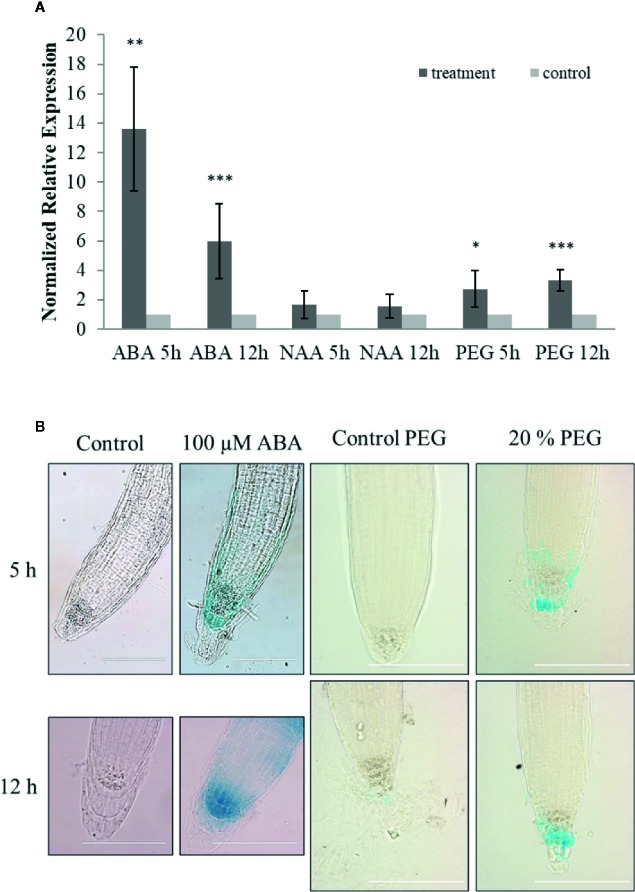
Figure 2.
Stress responsiveness of ArathEULS3 expression. (A) Normalized relative expression of ArathEULS3 in 14-day-old seedlings after ABA, NAA, and PEG treatment. Bars represent means ± SE normalized relative ArathEULS3 expression compared to mock-treated plants. Asterisks indicate statistically significant differences to the expression level in mock treated seedlings (*p ≤ 0.05, **p ≤ 0.01, ***p ≤ 0.001; REST analysis). The graphs represent the results of three independent biological replicates. (B) GUS staining of 8-day-old pArathEULS3::GUS lines treated with ABA and PEG for 5 and 12 h, compared to mock-treated plants. GUS staining was performed for 18 h. GUS staining was observed in more than 90% of the plants treated with ABA. GUS staining was apparent in 70% and 35% of the plants after 5 and 12 h of PEG treatment, respectively. The scale bar represents 0.1 mm.

