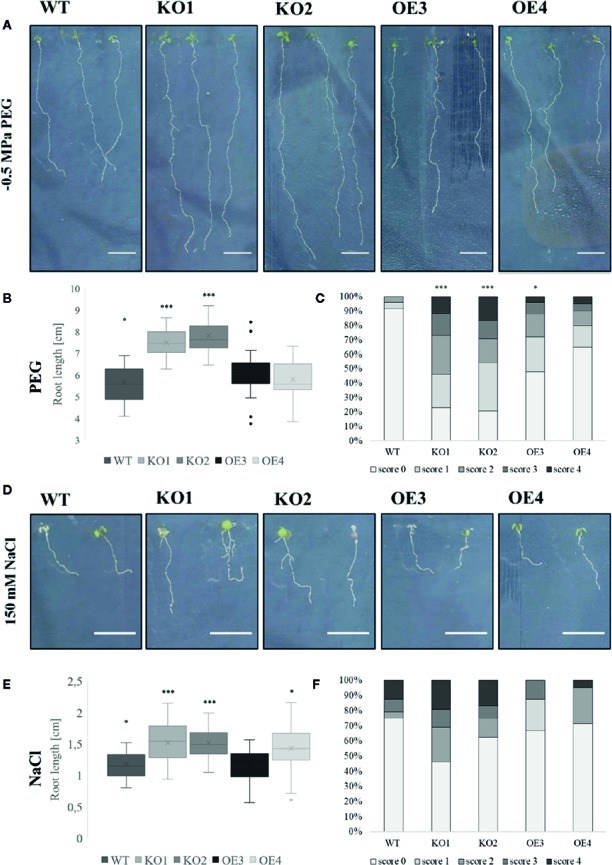
Figure 4.

Growth of transgenic lines after salt and osmotic stress treatments. (A, D) Root phenotype, (B, E) root length and (C, F) lateral root density of WT and transgenic lines grown on medium with or without PEG (−0.5 MPa) or salt (150 mM). The graphs represent three biological replicates with minimum 17 data points per condition. Scoring system for evaluation of lateral root density is explained in the Materials and Methods. The seeds of WT plants and transgenic lines (KO1, KO2, OE3, and OE4) were germinated in vitro for 3 days and the young seedlings were then transferred onto a medium containing stress factors (150 mM NaCl or −0.5 MPa PEG6000) for another 7 days. The comparison between the root length of WT and transgenic lines was made by using Independent-samples T-test for normally distributed data. The distributions of root length values are shown as box and whisker plots. The boxes represent the 25–75th percentiles, the median is indicated as a horizontal line, the mean is indicated as a cross, the outliers are represented as circles. The whiskers are equal to 1.5× the interquartile range. The comparison between the scoring of lateral root density between WT and transgenic lines was made by using Jonckheere-Terpstra test. (*p < 0.05, ***p < 0.001).
