
Figure 3. IO-RNA-NPs enhance DC activation and migration compared to electroporation.
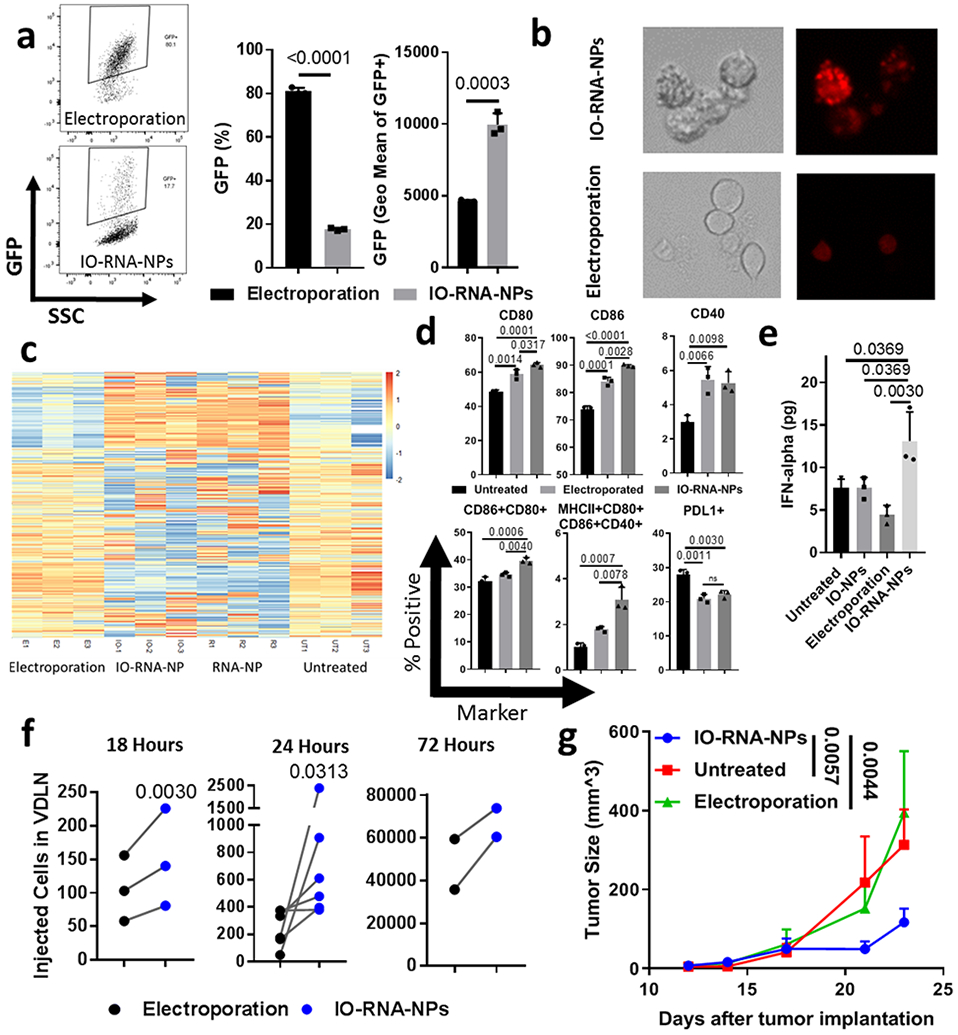
a, Representative flow cytometry plots (left), transfection efficiency (center) and geometric mean fluorescence intensity (right) 24 hours after transfection of BMDCs with GFP RNA via electroporation or IO-RNA-NPs (n=3). b, Fluorescent microscope images of DC2.4s incubated overnight with Cy3-labelled RNA-NPs. c, Heat map comparing mRNA expression in BMDCs 24 hours after treatment with GFP mRNA via RNA-NPs, IO-RNA-NPs, or Electroporation. d-e, Phenotypic markers of activation assessed by flow cytometry (d) and IFN-alpha release assessed by ELISA (e) for BMDCs 24 hours after treatment with electroporation or IO-RNA-NPs. One-way ANOVA and Tukey’s tests were used for statistical analysis. f, Migration of IO-RNA-NP-loaded BMDCs to VDLN at varying timepoints after intradermal injection. Statistical analysis was completed with Wilcoxon matched-pairs rank sum test for n>4 or student’s paired t test for n<4. g, Summary data showing tumor growth in mice (Untreated: n=6; Electroporation: n=6; IO-RNA-NPs: n=13) with subcutaneous B16F10-OVA tumors after a single vaccination with 500,000 BMDCs pulsed with OVA mRNA via electroporation or IO-RNA-NPs and 10 million naïve OT1 T-cells. Data is pooled from two independent experiments. A two-way ANOVA was used for statistical analysis. Results in a, b, and d-g are each representative of at least 2 replicate experiments. Numbers on graphs are P values.