
Figure 5. MRI-detected DC migration predicts response to DC vaccines.
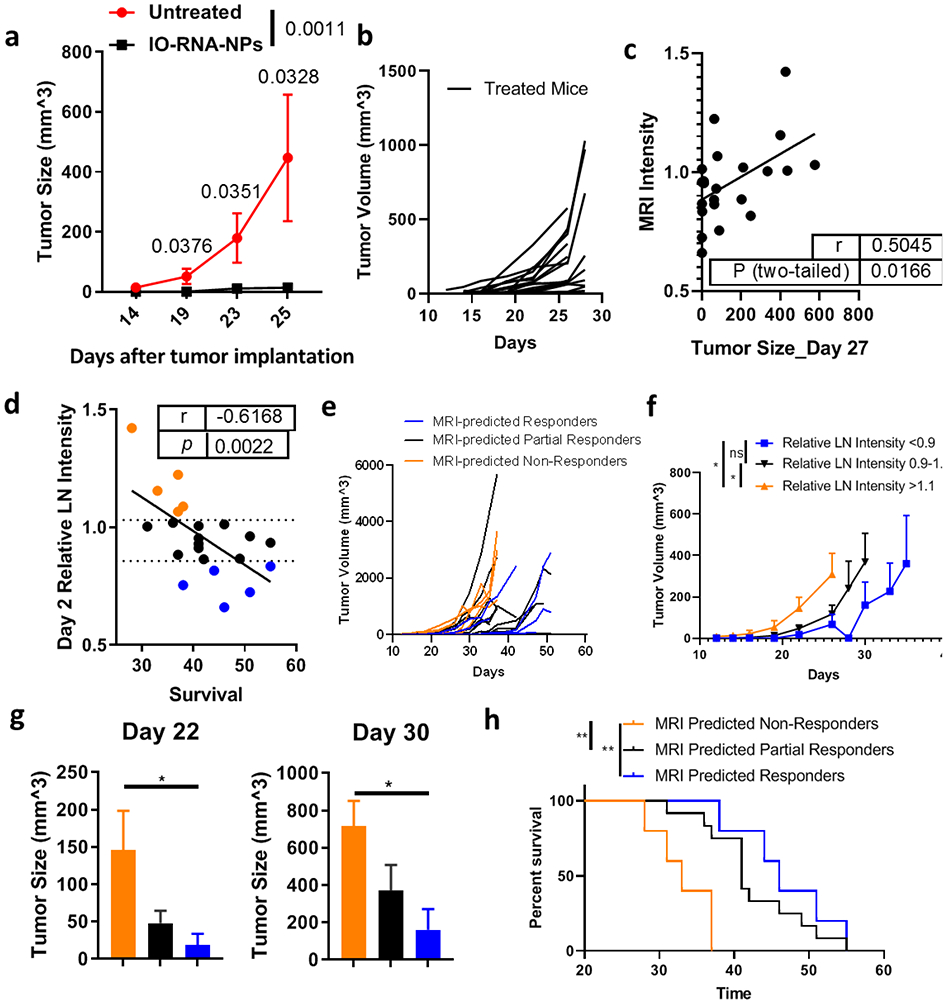
Mice with subcutaneous B16F10-OVA tumors were treated with BMDCs loaded with IO-RNA-NPs bearing ovalbumin mRNA. a, Tumor growth over time between treated mice (n=7) and untreated mice (n=5). Numbers on graph are P values calculated by unpaired student’s t tests. b, Growth of individual treated tumors from two independent experiments (n=20). c-d, Correlation of the relative change in MRI-detected lymph node intensity in treated compared to untreated lymph nodes (Relative LN Intensity) on Day 2 with Day 27 tumor size (c) and survival (d). Dotted lines demarcate the 25th and 75th percentiles of relative MRI intensity in lymph nodes. Datapoints from mice with substantial MRI-predicted DC migration indicated by relative VDLN intensity in the bottom 25th percentile are blue, those from mice with moderate VDLN intensity in the middle 50th percentile are black, and those from mice with high VDLN intensity in the top 75th percentile are orange. Data are combined from two independent experiments which each resulted in statistically significant correlations (see Supplementary Fig 10-11). Numbers on graphs c-d are derived from a Pearson correlation. e-h, Individual tumor growth curves (e), summary data (f), tumor sizes at multiple timepoints (g), and survival (h) separated by MRI intensity on Day 2 after vaccination. Numbers on graphs are p values calculated from ANOVA (f), Mann-Whitney (g), or Log-Rank tests (h).