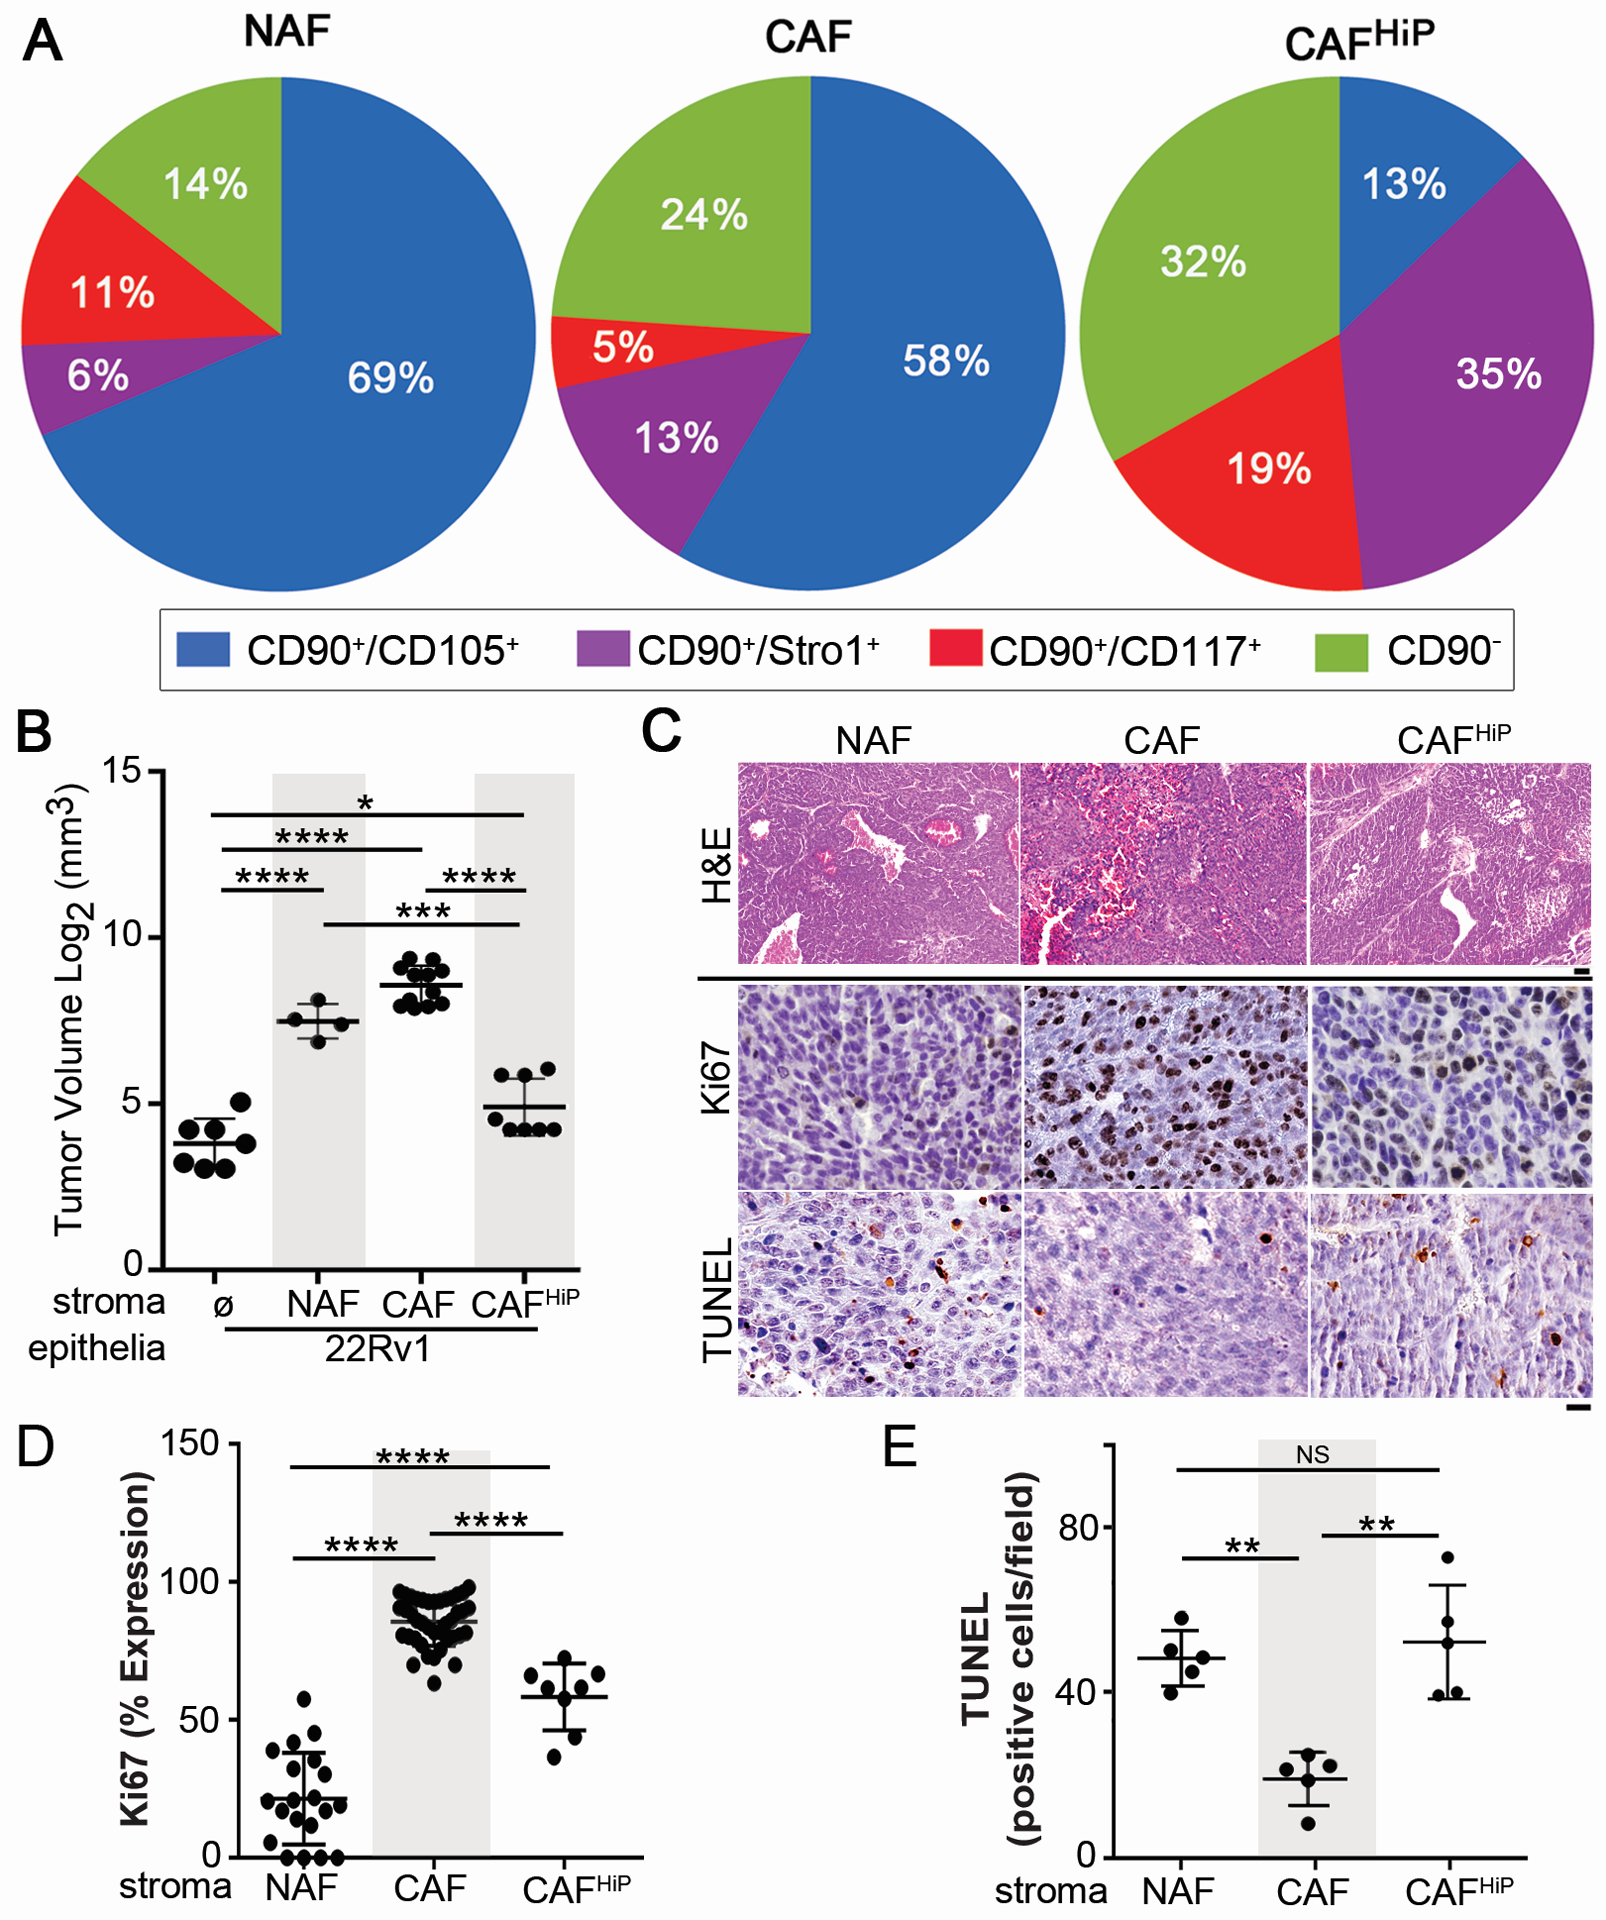
Figure 2. Stromal heterogeneity dictates tumor progression.

(A) Pie charts illustrate the relative ratio of the indicated stromal fibroblastic populations based on cell surface expression of the indicated markers: CD90+/CD105+ (blue), CD90+/Stro-1+ (purple), CD90+/CD117+ (red), and CD90− (green), n > 3. ANOVA analysis demonstrates NAF, CAF, and CAFHiP have distinct populations (p < 0.03). (B) Scatter plot indicates individual tumor volume (log transformed) for tissue recombinant tumors made up of 22Rv1 epithelia with the indicated fibroblastic populations. n > 4. (C) Histology for representative recombinant tumor sections of 22Rv1 with the indicated fibroblastic populations are shown. H&E staining shows tumor morphology (scale bar represents 64 μm). Ki67 and TUNEL immune-localization, with hematoxylin nuclear counterstain (scale bar represents 32 μm), is shown, n > 5. (D) The scatter plot shows quantitation of percent expression for Ki67 immunohistochemical staining, n > 8. (E) The scatter plot shows quantitation of the number of TUNEL positive nuclei per field by immunohistochemical staining, n > 5. For all, error bars are mean +/− SD, and p values of less than 0.05 were considered statistically significant (*P<0.05, **P<0.01, ***P<0.001, ****P<0.0001).
