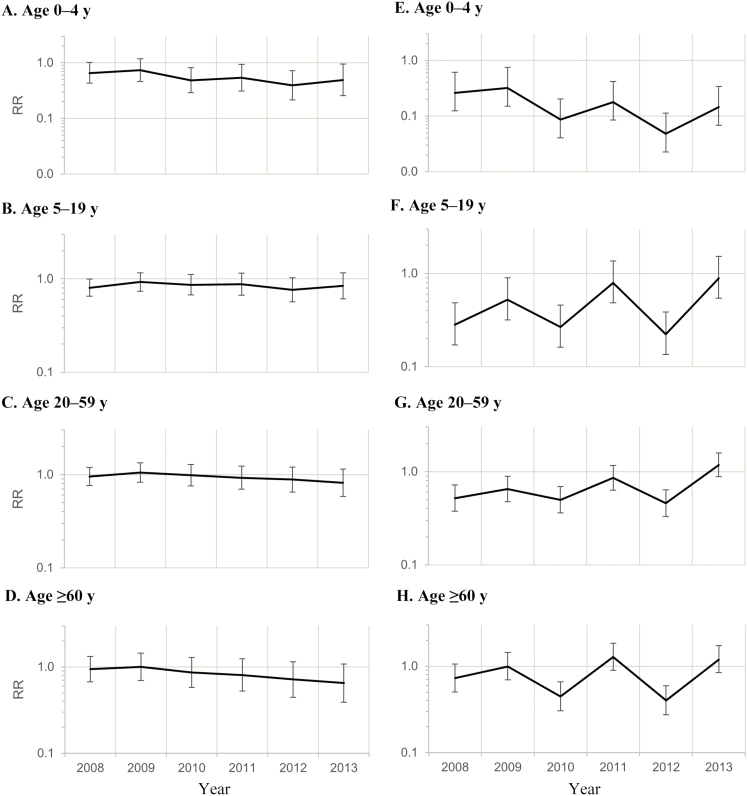
Figure 2.
Monthly all-cause acute gastroenteritis (AGE) (A–D) and rotavirus gastroenteritis (RVGE) (E–H) hospitalization rate ratios (RRs) comparing prevaccine (2000–2006) and postvaccine (2008–2013) periods by year. Data are from 26 US states from the Healthcare Cost and Utilization Project’s State Inpatient Databases; see Data Sources, in Methods, for the full list of states. A–D, AGE data based on negative binomial regression using a sequential (continuous) time variable to control for potential exogenous secular trends, restricted to the rotavirus season (January–June). E–H, RVGE data based on negative binomial regression controlling for the pre-2004 period, using an indicator variable to account for the increase in RVGE hospitalization rates that occurred just before 2004, including all months.

