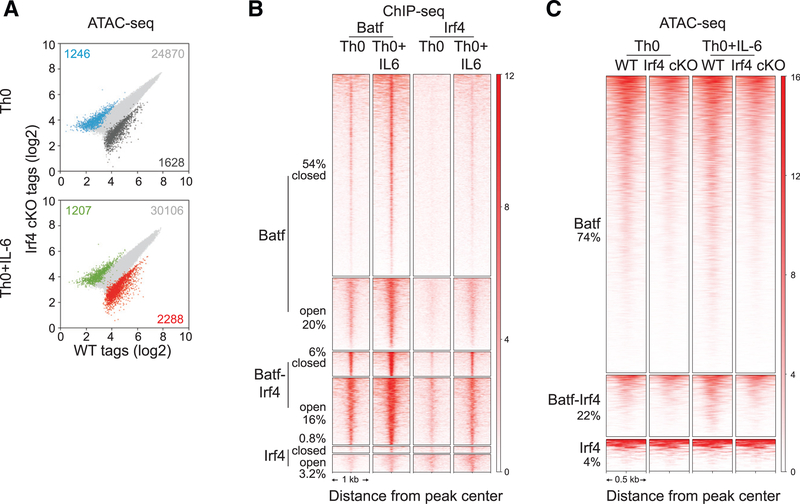
Figure 2. Irf4 Is Dispensable for Batf-Regulated Chromatin Accessibility in CD4+ T Cells.
(A) ATAC-seq analysis of 24-h activated WT andIrf4 conditional KO (cKO) Th0 and Th0+IL-6 cells. Scatterplots of normalized ATAC-seq tag density compare chromatin accessibility (fold change > 2; FDR < 0.05) between 24-h activated WT and Irf4 cKO Th0 and Th0+IL-6 cells.
(B) Irf4 ChIP-seq peaks from WT cells along with Batf ChIP-seq peaks (Figures 1F and 1G) integrated with chromatin accessibility (Figure 1F) identify unique Batf and Irf4 sites along with sites of Batf and Irf4 co-binding that are associated with closed and open chromatin regions. Heatmap density shows normalized Batf and Irf4 ChIP-seq signals in WT Th0 and Th0+IL-6 cells centered ± 1,000 bp of the indicated clusters. Percentages of Batf and Irf4 sites associated with closed and open chromatin are indicated.
(C) Heatmap density shows normalized ATAC-seq signals centered ± 500 bp of unique Batf and Irf4 sites along with co-bound Batf and Irf4 sites with percentages of sites compared between WT and Irf4-deficient cells in Th0 and Th0+IL-6 conditions.
Data are representative of two independent experiments with similar results

