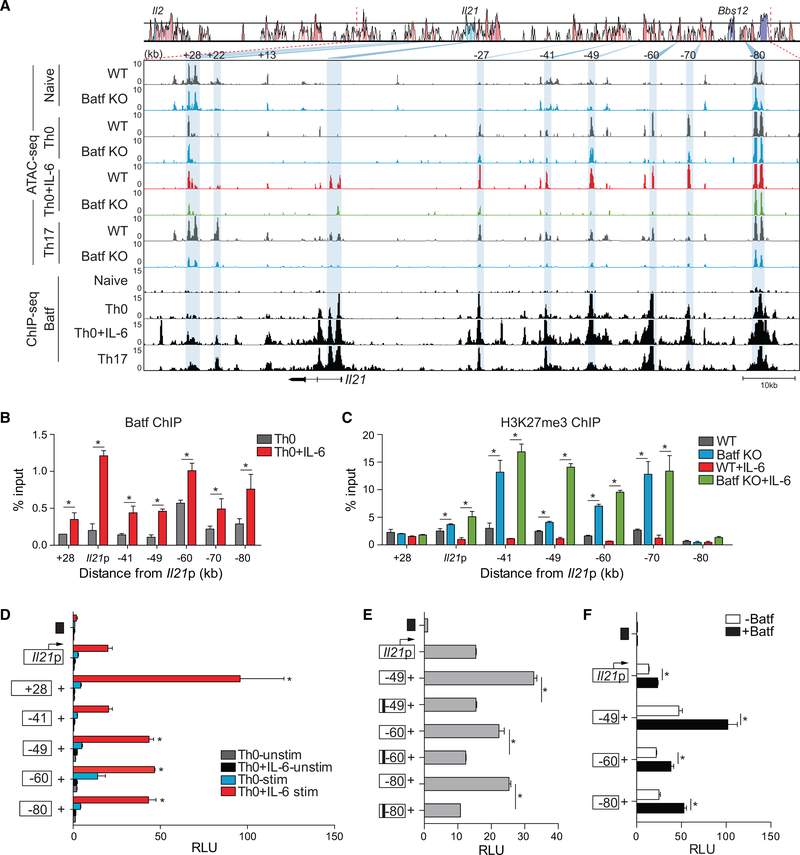
Figure 3. Altered Chromatin Accessibility at Genomic Regions Containing Batf Target Genes.
(A) Comparative chromatin accessibility and Batf recruitment to the mouse Il21 locus in WT and Batf KO naive, Th0, Th0+IL-6, and Th17 cells. ATAC-seq peaks (Figures 1C and 1D) and ChIP-seq peaks (Figures 1F and 1G) are shown aligned to a VISTA plot highlighting sequence conservation at key intergenic conserved non-coding sequence elements. Blue shading indicates diminished chromatin accessibility in Batf KO compared with WT cells.
(B and C) ChIP-qPCR analysis of Batf and H3K27me3 binding to Il21 genomic regions. Batf recruitment to the Il21 locus in WT Th0 (gray) and Th0+IL-6 (red) shown in (B) and H3K27me3 binding in WT Th0 (gray), Th0+IL-6 (red), Batf KO Th0 (blue), and Th0+IL-6 (green) in (C). Data are normalized to total input samples and IgG control.
(D) The mouse Il21 promoter was linked to a firefly luciferase reporter construct and selected Il21 conserved non-coding sequence elements were juxtaposed upstream of the promoter. Day-3 Th0 and Th0+IL-6 cells were transfected with an empty control vector (black box), the Il21 promoter construct alone, or constructs containing the Il21 promoter and the indicated conserved non-coding sequence and then rested overnight, restimulated with phorbol myristate acetate (PMA) and ionomycin for 5 h and assessed for luciferase expression.
(E and F) Day-3 WT Th0+IL-6 cells were transfected as in (D) with WT or mutated Batf consensus motif-containing conserved non-coding sequence (black bars) (E); or in the presence or absence of a Batf-expressing vector (F). Data are normalized to the empty vector control.
Data are means ± SEM of three to four independent experiments with one mouse per experiment (B–F) or representative of two independent experiments with similar results (A). RLUs, relative light units. *p < 0.05 (Student’s t test or one-way ANOVA, followed by Tukey’s test).

