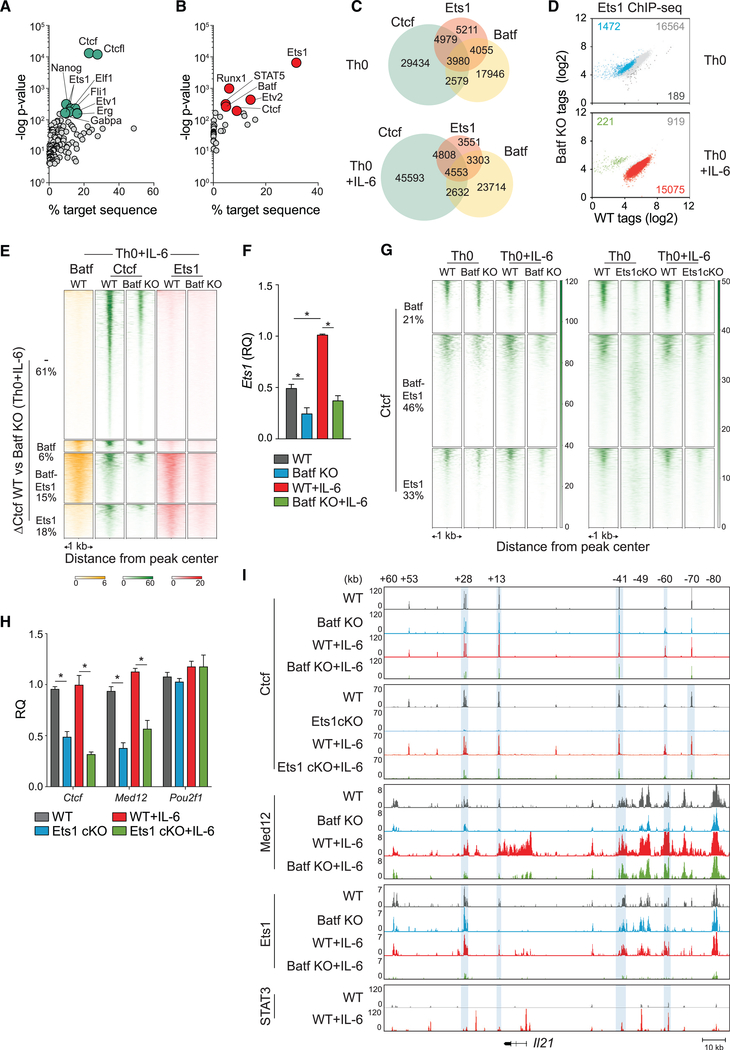
Figure 5. Ets1 and Batf Are Required for Modulating Ctcf Occupancy in the Genome of Activated CD4+ T Cells.
(A) Motif enrichment analysis of Batf-dependent Ctcf peaks exclusive of Batf binding represented by scatterplot with cyan dots indicating top 10 motifs with lowest p value. Analyzed peaks were collected by integrating Ctcf ChIP-seq data from 96-h WT Th0 and Th0+IL-6 versus Batf KO Th0 and Th0+IL-6 with Batf ChIP-seq peaks (Figure 1F).
(B–E) Ets1 ChIP-seq peaks from 96-h WT and Batf KO Th0 and Th0+IL-6 subjected to motif-enrichment analysis identified Batf and Ctcf motifs represented by scatterplot with red dots indicating top motifs with the lowest p value (B). Ctcf, Batf, and Ets1 coincident and independent binding derived from Batf ChIP-seq (Figure 1F), Ctcf ChIP-seq (Figure 4D) and Ets1 ChIP-seq data from 96-h WT and Batf KO Th0 and Th0+IL-6 (as in B) (C). Scatterplots show normalized Ets1 ChIPseq tag density with numbers of differential peaks (fold change > 2; FDR < 0.05) compared between WT and Batf KO cells (D). Batf and Ets1 ChIP-seq peaks from WT and Batf KO cells integrated with enriched Ctcf peaks in WT compared with Batf KO (DCtcf WT versus Batf KO) in Th0+IL-6 cells identify Ctcf sites that are cobound with Ets1 and Batf or with Ets1 or Batf alone. Heatmap density shows normalized Batf, Ctcf, and Ets1 ChIP-seq signals compared between WT and Batf KO in Th0+IL-6 cells centered ± 1 kb of the indicated clusters. Percentages of ΔCtcf (WT versus Batf KO) sites associated with Batf and Ets1 sites are shown (E).
(F) Ets1 expression in WT and Batf KO Th0 and Th0+IL-6 cells 96-h after stimulation assessed by RT-PCR. Values were normalized to expression in WT+IL-6 cells to calculate relative quantification.
(G) Comparison of Batf- and Ets1-dependent Ctcf recruitment derived from Ctcf ChIP-seq peaks from Ets1cKO Th0 and Th0+IL-6 cells compared with WT and Batf KO ChIP-seq regions. Heatmap density shows normalized Ctcf ChIP-seq signals center ± 1 kb of clusters corresponding to Ctcf binding along with co-bound Ets1, Batf, or both. Percentages of Ctcf sites associated with Batf and Ets1 sites are shown.
(H) Naive WT and Ets1 cKO CD4+CD62hi T cells were activated with anti-CD3 and anti-CD28 ± IL-6 for 96 h; total RNA was extracted, and gene expression was assessed by RT-PCR. WT cells were used as controls to calculate relative quantification.
(I) Ctcf, Med 12, and Ets1 ChIP-seq data from WT, Batf KO, and Ets1 cKO Th0 and Th0+IL-6 and STAT3 ChIP-seq data from WT Th0 and Th0+IL-6 aligned to the extended Il21 locus. Blue shading highlights reduced binding in Batf KO and Ets cKO cells compared with WT cells. Data for STAT3 ChIP--seq are from GSE:65621.
Data are means ± SEM of three to five independent experiments with one individual mouse per experiment (F and H), or representative of two independent with similar results (A–E, G, and I). RQ, relative quantification. *p < 0.05 (one-way ANOVA followed by Tukey’s test).

